Glenn McDonald attempts to graph the musical space in its entirety on a…
-
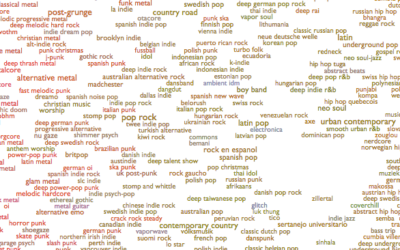
Graphing all the music
-
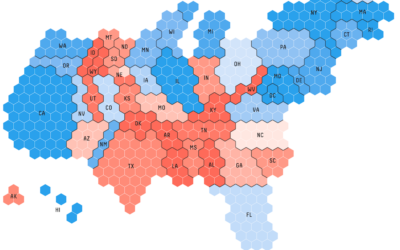
Election forecast tracker
FiveThirtyEight published their election forecast tracker this week, and it’s a beaut. It…
-
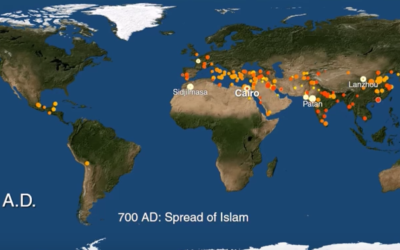
Growth of cities, going back 6,000 years
Meredith Reba, Femke Reitsma and Karen C. Seto compiled a dataset of urban…
-
D3 4.0 released
I typically don’t care much about code releases, but every interactive chart I…
-
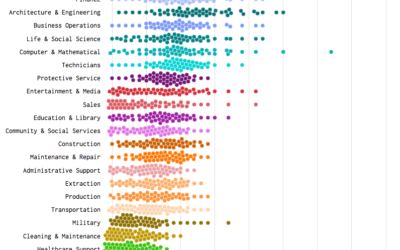
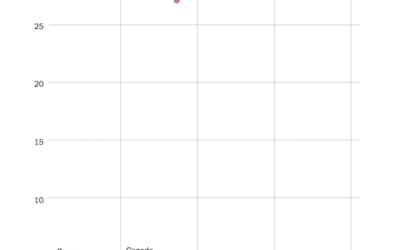
Shifting Incomes for American Jobs
For various occupations, the difference between the person who makes the most and the one who makes the least can be significant.
-
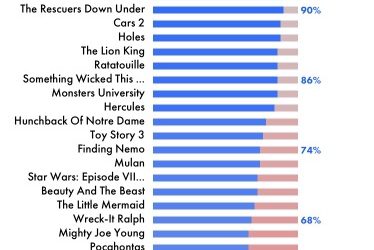
Gender equality in the movies, a screenplay analysis
Hollywood has been talking gender equality in the movies more than usual lately,…
-
Another Data Point On the Way
We have another data point on the way, so it might suddenly go…
-

Procedurally generated spaceships
Video game developer Michael Davies provides a Blender script to procedurally generate pretty…
-

Sci-Fi short film scripted by machine learning algorithm
Filmmaker Oscar Sharp and technologist Ross Goodwin fed a machine learning algorithm with…
-
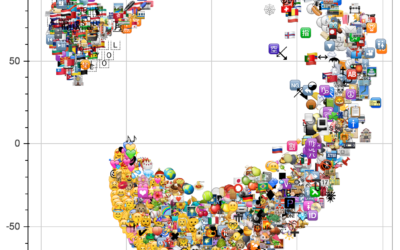
Emoji semantic space
Dango is an Android app that predicts relevant emojis as you type. Xavier…
-

What happened at Pulse in Orlando
The Tampa Bay Times takes you through a 3-D model of Pulse Nightclub…
-

Who Still Smokes?
Two decades out from the first statewide ban on smoking in enclosed workplaces, here’s who still smokes.
-
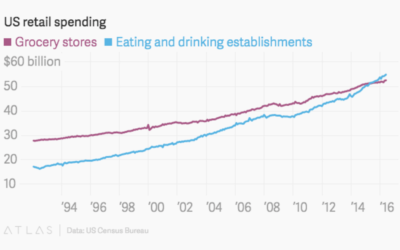
We spend more at restaurants than at grocery stores
For decades, Americans spent more money at the grocery store than at eating…
-

Motion capture dance
Really fun. “Motion capture, procedural animation and dynamic simulations combine to create a…
-
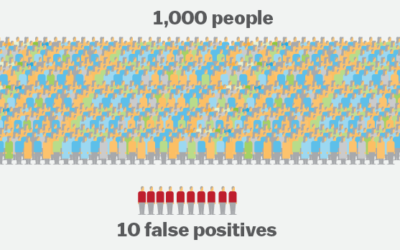
Nearly impossible to predict mass shootings with current data
Even if there were a statistical model that predicted a mass shooter with…
-
U.S. gun deaths rate is an outlier
If you look at gun death rates for other western countries and adjust…
-
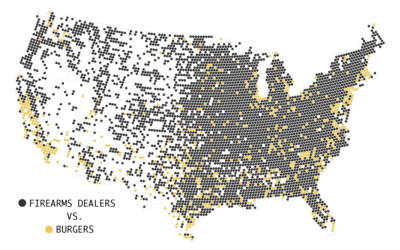
Firearms Dealers vs. Burgers, Pizza, and Coffee
As of May 2016, there were 64,432 licensed firearms dealers and pawnbrokers, which got me wondering how that compares to other businesses.
-
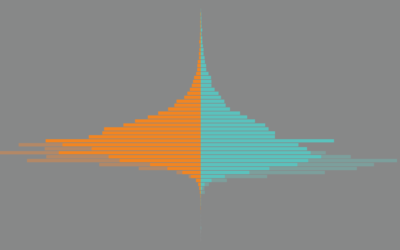
Americans are Growing Bigger
We keep getting bigger. Watch overweight and obesity rates move up over several decades.
-
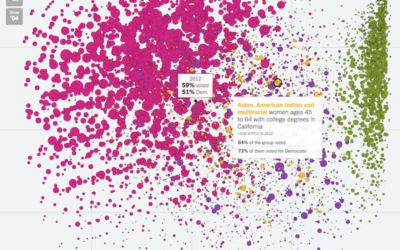
Voting habits for various demographic groups
Voter turnout and political leanings for various demographic groups play an important role…
-
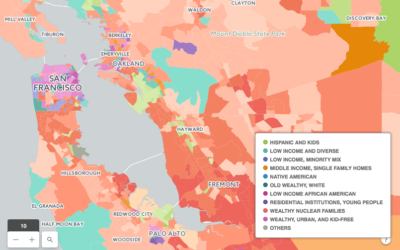
A map about the people who live there
Geographers Seth Spielman and Alex Singleton used something called “geodemographic classification” to classify…
Recently for Members
Second Edition
 Visualize This: The FlowingData Guide to Design, Visualization, and Statistics (2nd Edition)
 Visualize This: The FlowingData Guide to Design, Visualization, and Statistics (2nd Edition)
New tools, refined process.
Browse by Chart Type See All →


