R.I.P.…
-
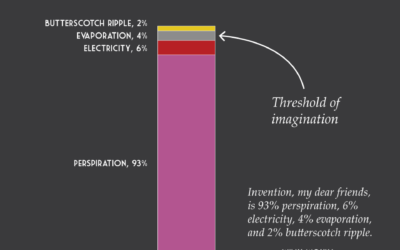
Invention
-
What Alcohol People Around the World Drink
Americans get most of their alcohol from beer, but it’s not like that everywhere.
-
Sans human, Facebook’s Trending Topics algorithm faired poorly
Last week, Facebook announced that it was making the Trending Topics section more…
-
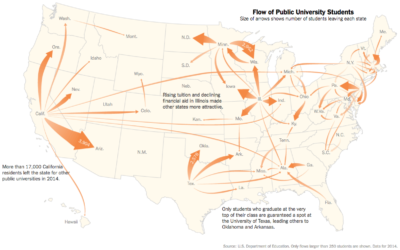
Out of state, public education
Nick Strayer for the New York Times shows the flow of college freshman…
-
D3 in Depth
D3 is the most commonly used JavaScript library for visualization on the web,…
-
Link
A Career Built on Side Projects →
My whole career is a side project.
-

This is Parenthood
Raising kids is hard to explain. I’ll try anyways. With some charts.
-

Rhyming schemes in Hamilton the musical
Hamilton is unique in its use of complex rhyming lyrics. Joel Eastwood and…
-
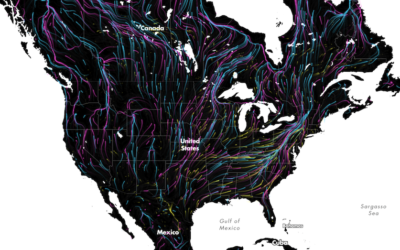
Animal migrations in animated map
The Migrations in Motion map, by Dan Majka from the The Nature Conservancy,…
-
Members Only

Make a Moving Bubbles Chart to Show Clustering and Distributions
Use a force-directed graph to form a collection of bubbles and move them around based on data.
-
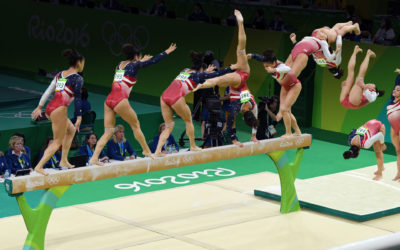
Composite Olympic moments
One more Olympics-related piece for the road. The New York Times used photo…
-

Colorgorical generates color schemes for you
Sometimes you need a color scheme quick, and ColorBrewer is typically the de…
-
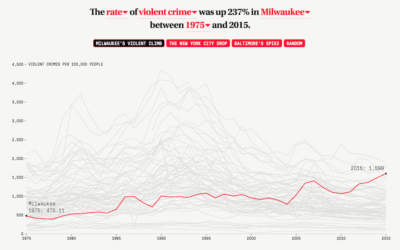
The different trends in American crime
Crime is up? Crime is down? It depends on who you ask and…
-
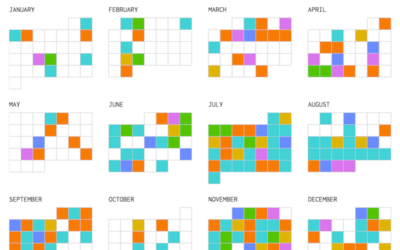
All the National Food Days
Keep track of the 214 days out of the year that are a national food or drink days.
-
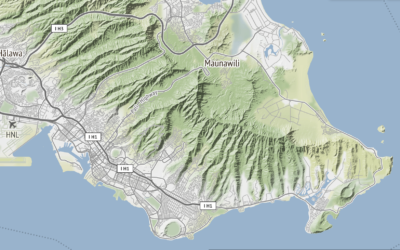
Global terrain maps from Stamen
Missed this one from last month. Stamen announced the release of a whole…
-
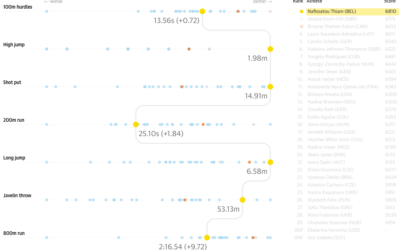
Heptathlon rankings with parallel coordinates
The Guardian covered the rankings for the women’s heptathlon, specifically how Nafissatou Thiam…
-

Long-exposure bird flights
Using a long-exposure photography technique, Xavi Bou captured bird flight patterns in his…
-

Every fastest man on one track
The New York Times has been pulling from the vault for this year’s…
-

Open data board game
Datopolis is a board game by Ellen Broad and Jeni Tennison from the…
-

Why all the swimming ties in the Olympics
As the Olympics are all about reaching peak physical potential, it shouldn’t surprise…
Recently for Members
Second Edition
 Visualize This: The FlowingData Guide to Design, Visualization, and Statistics (2nd Edition)
 Visualize This: The FlowingData Guide to Design, Visualization, and Statistics (2nd Edition)
New tools, refined process.
Browse by Chart Type See All →


