People are usually not great at remembering exact colors. Dialed is a fun…
Design
Important in presenting data clearly and beautifully.
-
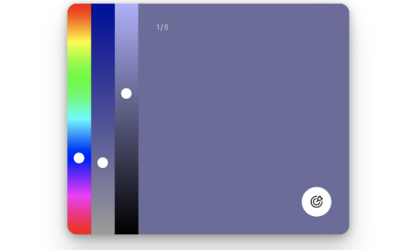
Dialed, a color memory game
-

Times New Roman vs. Calibri typefaces
The State Department decided that they will use Times New Roman instead of…
-
Design suggestions to make more accessible visualizations
Making charts that are accessible to those with visual difficulties might seem like…
-
Data graphics off the screen
RJ Andrews held an exhibition of data graphics at 41 Cooper in New…
-

National history archived through chopstick sleeve designs
For Letterform Archive, designer Angie Wang examines a collection of chopstick sleeves as…
-

Ubiquity of the Gorton font
Marcin Wichary dives deep into the Gorton font, calling it the hardest working…
-
Improving axes on a chart
Nicola Rennie provides five quick tips to improve on default axis scales:
[T]he… -
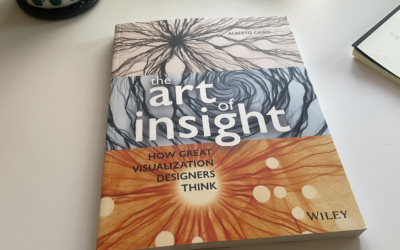
A wide view of visualization with ‘The Art of Insight’
The Art of Insight, by Alberto Cairo, highlights how designers approach visualization with…
-
Fonts primer
The Washington Post provides an introduction to fonts with mini-quizzes and straightforward examples.…
-

An interactive guide to color and contrast
Color and contrast choices often are a product of personal preferences, but you…
-
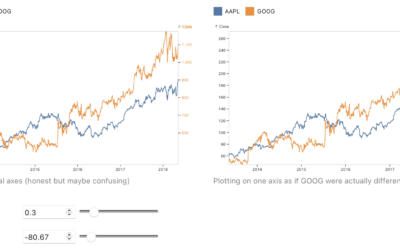
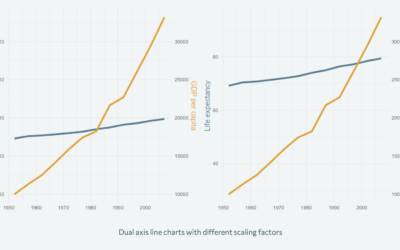
Arguing in favor of dual axes to show correlation
Charts that use two different scales on the same vertical often get the…
-

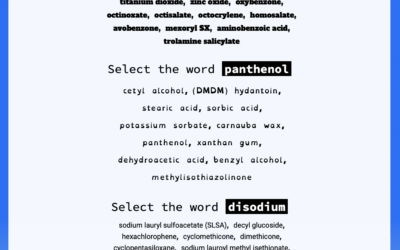
A colorblind view of the web
If you don’t use a colorblind-safe color palette in your maps and charts,…
-
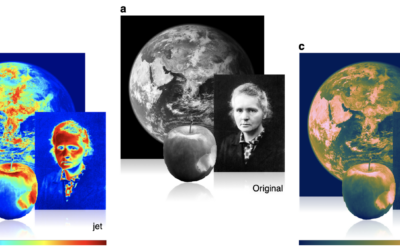
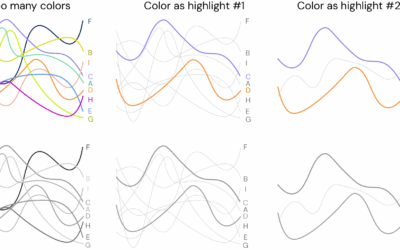
Misuse of the rainbow color scheme to visualize scientific data
Fabio Crameri, Grace Shephard, and Philip Heron in Nature discuss the drawbacks of…
-
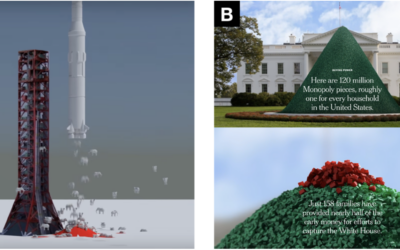
Cinematic visualization
Using the third dimension in visualization can be tricky because of rendering, perception,…
-
Dashboard Design Patterns
Dashboards aren’t really my thing, but we’ve seen, especially over the past few…
-

Difficulties reading the cone of uncertainty
It seems that there is always surprise when a hurricane makes landfall in…
-
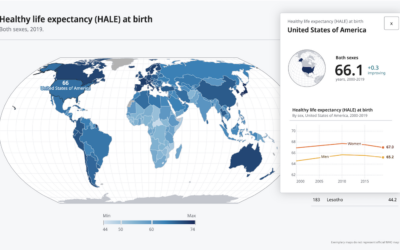
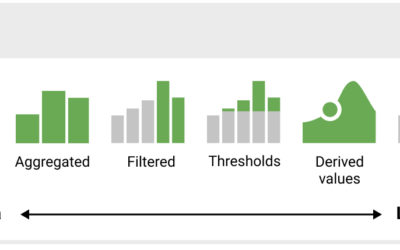
Developing a data design language for the World Health Organization
In a collaborative effort with UX agency Kore, Moritz Stefaner describes work with…
-
Choosing fonts for your charts
Changing the fonts you use for labels and annotation is one of the…
-
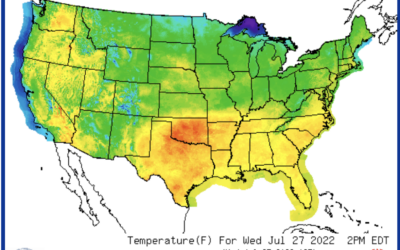
Mapping extreme heat
For Bloomberg, Marie Patino reports on the shifting design choices for mapping weather…
-
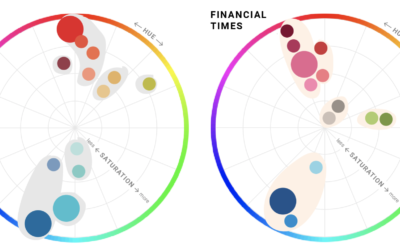
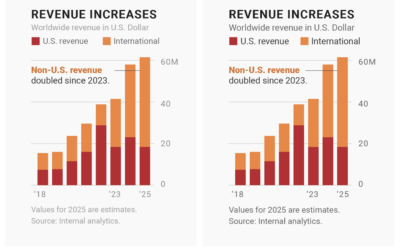
Defining color palettes for all your charts
Selecting a color palette for a single chart can be tricky, which is…
Recently for Members
Second Edition
 Visualize This: The FlowingData Guide to Design, Visualization, and Statistics (2nd Edition)
 Visualize This: The FlowingData Guide to Design, Visualization, and Statistics (2nd Edition)
New tools, refined process.
Browse by Chart Type See All →


