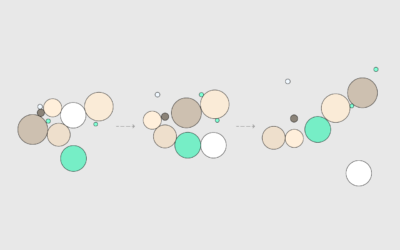
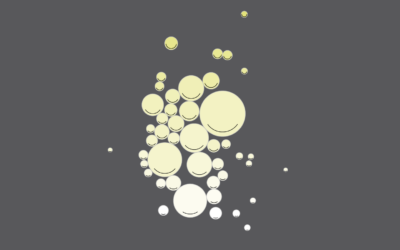
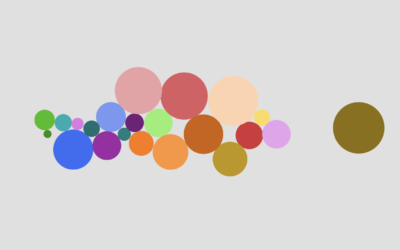
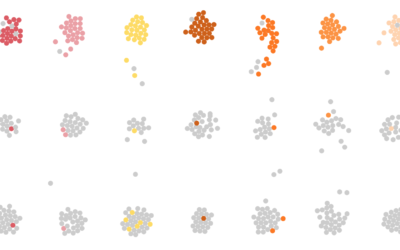
Making use of a force-directed graph, bubbles move between different clusters to show grouping over time.
Pack circles, figure out the transitions between time segments, and then generate frames to string together.
Ooo, bubbles... It's not the most visually efficient method, but it's one of the more visually satisfying ones.
Use a force-directed graph to form a collection of bubbles and move them around based on data.
Earlier this year, the administration halted USAID shipments of antimalarial and HIV medical…
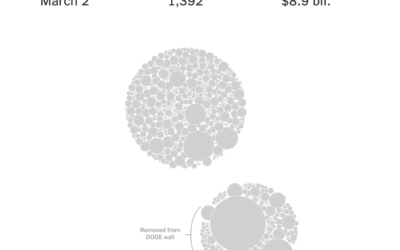
The “Department of Government Efficiency” keeps a “Wall of Receipts” to signal transparency…
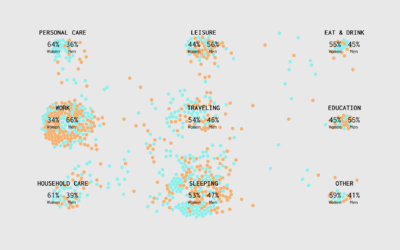
What people are doing when they are happy and not, from age 20 to 70.
Agar.io is a multiplayer game where people control cells in a Petri dish-type…
With Chartball, Andrew Garcia Phillips has visualized sports data for a while, publishing…
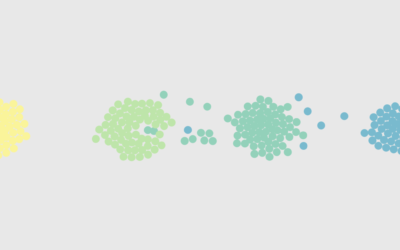
You’ve probably seen the moving bubbles that show how something changes over time.…
Oftentimes what we're doing isn't so important as who we're spending our time with.
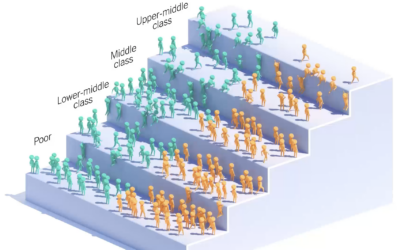
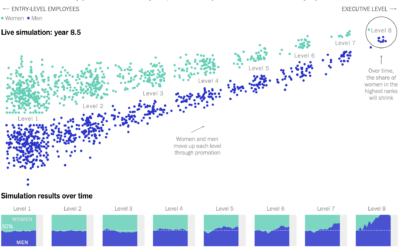
Yuhao Du, Jessica Nordell, and Kenneth Joseph used simulations to study the effects…
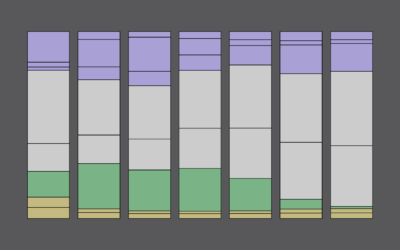
Unemployment has hit some industries more than others. Here's how the most recent estimates compare against last year's.
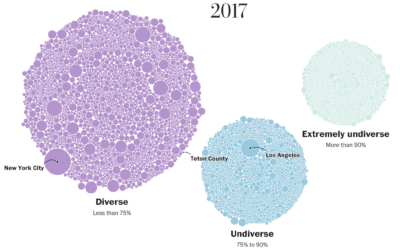
The Washington Post visualized 13,000 school districts to show the change in diversity…
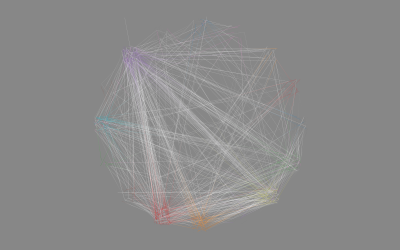
Everyone's relationship timeline is a little different. This animation plays out real-life paths to marriage.
Using the past couple of years of data from the American Time Use Survey, I simulated a working day for men and women to see how schedules differ. Watch it play out in this animation.
I simulated a day for employed Americans to see when and where they work.
I wanted to see how daily patterns emerge at the individual level and how a person's entire day plays out. So I simulated 1,000 of them.