The Economist shows probabilities that a person votes for each party, given a…
election
-
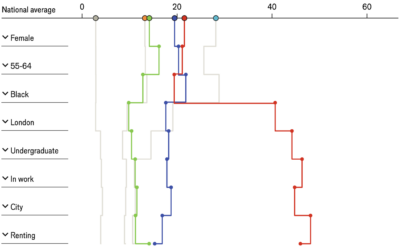
Build a British voter
-

Shifts back to the left for Hispanic voters
In 2024, Hispanic voters in New Jersey took a hard shift to the…
-

Shifts left for every demographic group, 2025 elections
G. Elliot Morris, for Strength in Numbers, breaks down the shift towards Democrat…
-
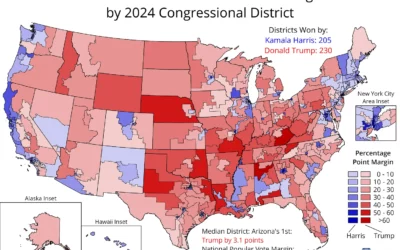
Complete 2024 election data, for congressional districts
Election data should be publicly available and easy to access at high granularity,…
-
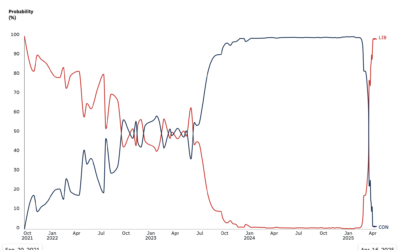
Sharp flip in probabilities of parties winning Canada election
Since early 2024, polls showed near certainty that Conservatives in Canada were going…
-
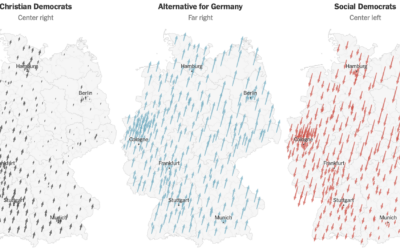
Shifts in German election
German voters shifted away from the left in their general election this past…
-

Extremely detailed 2024 election data, precinct level
As is tradition, The New York Times published a detailed map of presidential…
-

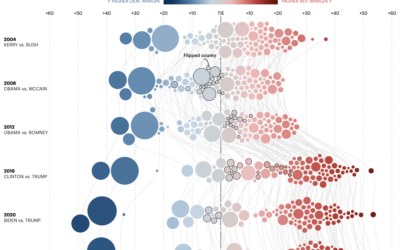
Swooping vote margins
The New York Times used swooping arrows to show vote swings left and…
-
Margin of victory over past elections, in Minnesota
For the Minnesota Star Tribune, Yuqing Liu and C.J. Sinner show how the…
-

Dot density map for election results
With what is now a common mapping method, The Economist used a dot…
-

Mapping every voter as a grain of sand
To show the mix of votes across the country, the Washington Post used…
-

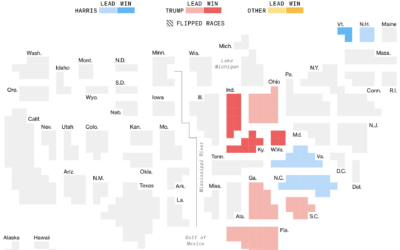
Jello map as states are called
The Bloomberg Graphics desk is building out a jello map as states are…
-
Electoral vote cartogram
The major news outlets all have electoral vote cartograms, but I appreciate Bloomberg’s…
-
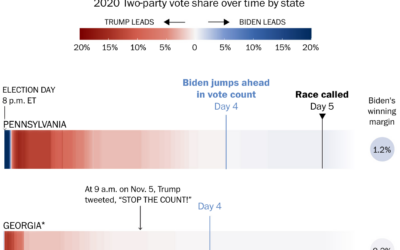
Why states swing while counts come in
Some might wonder why early results lean towards a party and then shift…
-

Live map of county shifts
The Washington Post has a live county map that shows the shift towards…
-

Election touchscreen really deep dive by The Onion
The Onion gained access to the most granular election data yet. Technology sure…
-
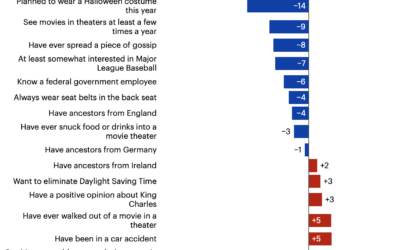
Presidential candidate preferences, by offbeat demographics
You’ve seen the voting tendencies among standard demographic groups, but there is so…
-
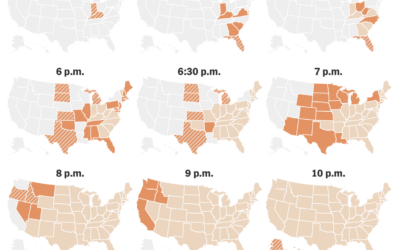
When the polls close
For The New York Times, June Kim, Leanne Abraham, and Maggie Astor provide…
-

Winning the Electoral College, a mini-game
For The New York Times, Lily Boyce, Jon Huang, and Blacki Migliozzi made…
-
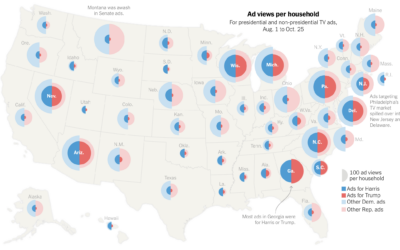
Election ad views for Democrats and Republicans
For NYT Opinion, Gus Wezerek compared ad views per household:
To figure out…
Recently for Members
Second Edition
 Visualize This: The FlowingData Guide to Design, Visualization, and Statistics (2nd Edition)
 Visualize This: The FlowingData Guide to Design, Visualization, and Statistics (2nd Edition)
New tools, refined process.
Browse by Chart Type See All →


