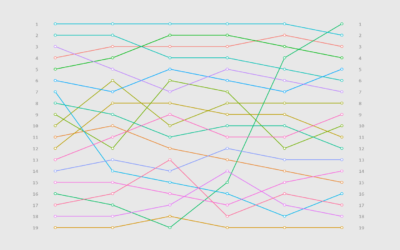
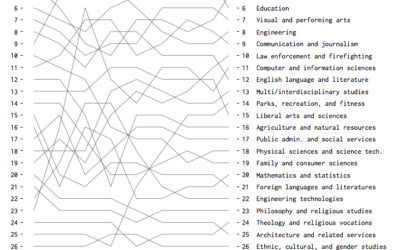
It looks like a line chart. However, the focus is specifically on ranks, usually over time.
Visualize rankings over time instead of absolute values to focus on order instead of the magnitude of change.
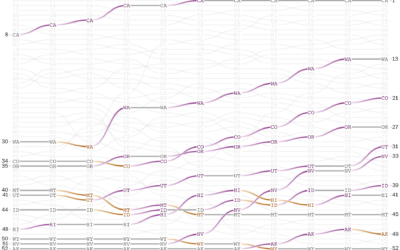
Over the decades, we can see the shifts (and non-shifts) in professional priorities and interests by looking at what college students are studying.
Job types changed over the years, because there were these things called computers that created occupations and shifted others. How did income change for different jobs, relative to everyone else?
We spend a lot of time working. It seems worth thinking about how we feel during all those hours.
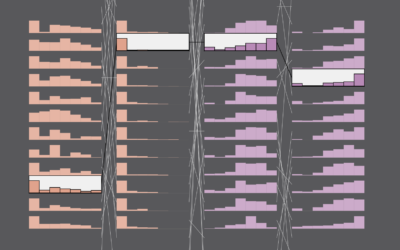
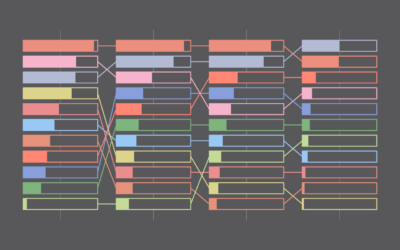
Here's the breakdown by age for American adults in 2021, based on data from the Pew Research Center.
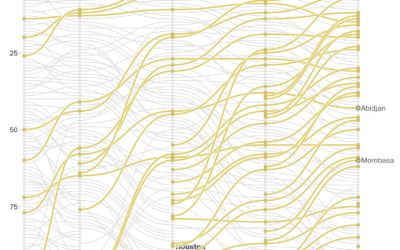
In a multi-faceted piece, The Washington Post described the rapidly growing cities in…
The places in the United States with the highest populations weren’t always like…
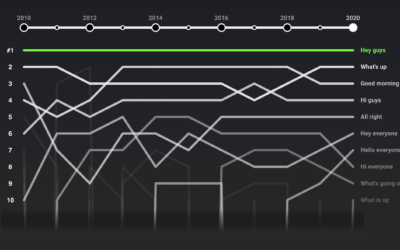
If you’ve watched even just a few videos on YouTube, you probably noticed…
Based on bachelor's degrees conferred, here are the fields that were and are currently popular.
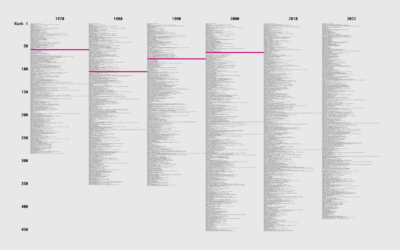
Based on annual high school play and musical rankings from the magazine Dramatics,…