Several years ago, Andy Kirk watched every episode of the sitcom Seinfeld, all…
Statistical Visualization
Finding patterns, distributions, and anomalies.
-
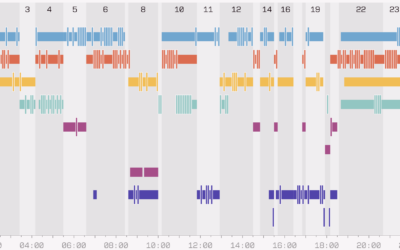
Seinfeld episodes and characters, a visual exploration
-
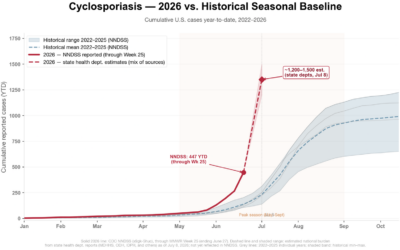
Exploding cyclosporiasis outbreak
Since the U.S. federal government is of little help in providing information about…
-
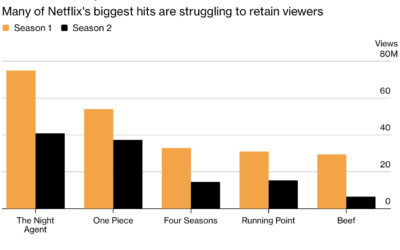
Netflix second-season slump
Netflix shows tend to draw a lot of viewers in the first season…
-
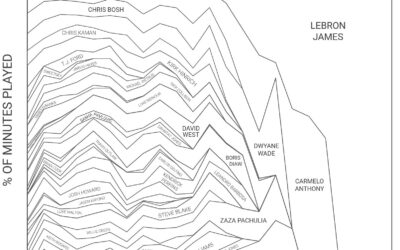
LeBron James longevity in minutes played
Fun stacked area chart by Todd Whitehead for Sportradar, showing the share of…
-
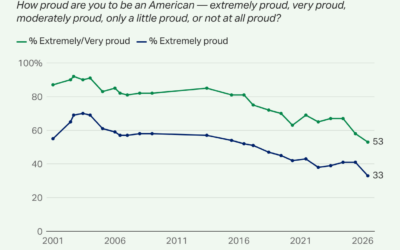
American pride declines to 25-year record low
Gallup has been surveying U.S. adults about American pride since 2001. The question:…
-
Climate.us, successor to Climate.gov, launches to the public
The administration closed Climate.gov last year during the takedowns, so a group formed…
-
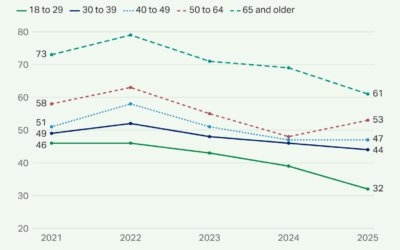
Less than half of U.S. adults have access to quality healthcare
A recent Gallup poll shows less than half of U.S. adults say they…
-
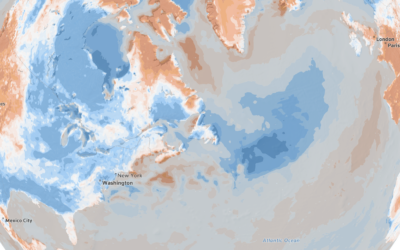
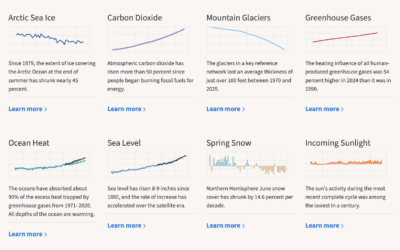
Comparing today’s temperature against historical averages
When you have that feeling that today is abnormally hot or cold for…
-
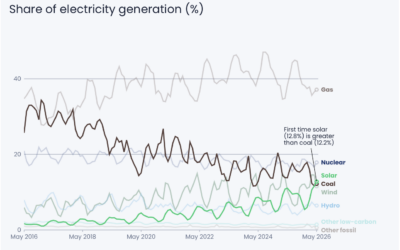
Solar passes coal for US electricity
Another recent flip: Based on estimates from Ember, monthly solar-generated electricity reached an…
-
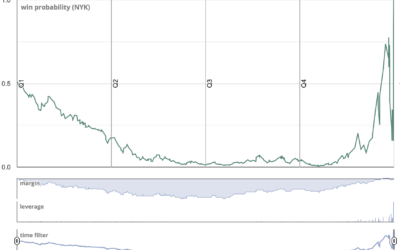
Flip in win probability for Knicks vs. Spurs
Speaking of when data flips, last night in game four of the 2026…
-
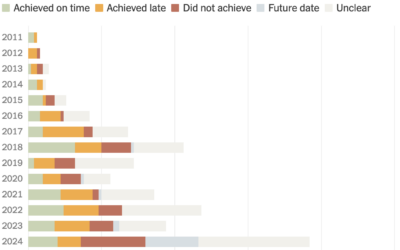
Elon Musk’s promise achievement rate over the years
The New York Times counted Elon Musk’s promises on X/Twitter and Tesla earnings…
-
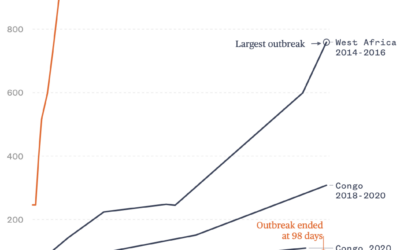
Ebola outbreak trajectories
For NBC News, Jane Weaver, Jiachuan Wu, and Javier Zarracina report on the…
-
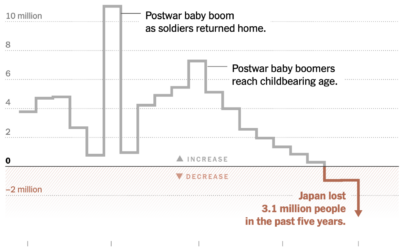
Population in Japan continues decline
Japan has been aging and having fewer children, which led to a decline…
-
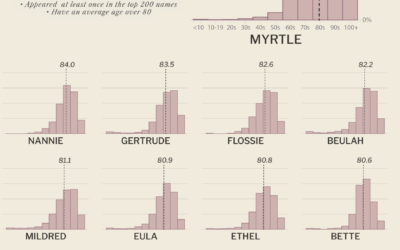
U.S. names with the oldest population
Erin Davis calculated the average age of people with a given name to…
-

Voters shifting away from the two-party system
U.S. voters have historically stuck with two political parties, but that’s changing in…
-
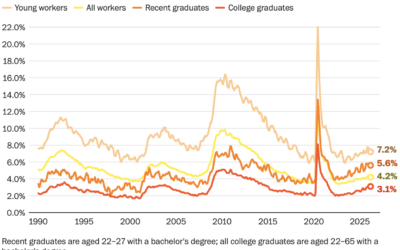
More difficult for recent graduates to find jobs
For the Washington Post, Federica Cocco and Taylor Telford report on the increasing…
-
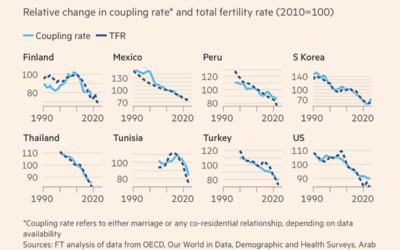
Declining birth rates globally
Birth rates are falling nearly everywhere. For Financial Times, John Burn-Murdoch explores why…
-
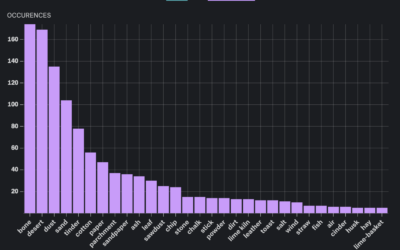
Analysis of similes in literature
For the Pudding, Russell Samora, with design and illustration by Shelly Tan, analyzed…
Recently for Members
Second Edition
 Visualize This: The FlowingData Guide to Design, Visualization, and Statistics (2nd Edition)
 Visualize This: The FlowingData Guide to Design, Visualization, and Statistics (2nd Edition)
New tools, refined process.
Browse by Chart Type See All →


