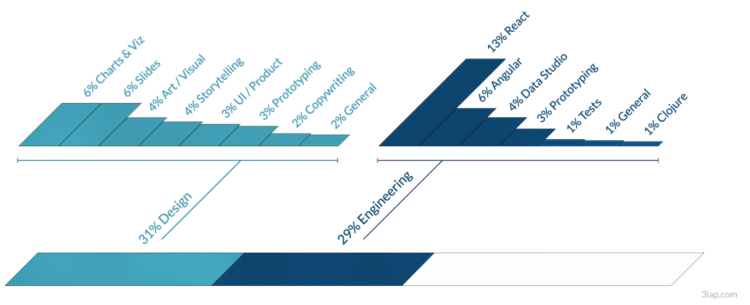
-
Members Only
-
After Hurricane Ida, New Orleans experienced power outages. The NASA Earth Observatory show the outages by comparing night lights on August 31, 2021 against night lights on August 9, 2021:
VIIRS has a low-light sensor—the day/night band—that measures light emissions and reflections. This capability has made it possible to distinguish the intensity, types, and sources of lights and to observe how they change. The data are then processed by the Black Marble team to account for changes in the landscape (such as flooding), the atmosphere, and the Moon phase, and to filter out stray light from sources that are not electric lights.
-
How Humans Judge Machines is an academic publication covering the results of experiments on how humans judge machines. The digital version is free, or you can purchase a print version.
How Humans Judge Machines compares the reactions of people in the United States to scenarios describing human and machine actions.
Our data shows that people do not judge humans and machines equally, and that these differences can be explained as the result of two principles.First, people judge humans by their intentions and machines by their out- comes.
By using statistical models to analyze dozens of experiments (chapter 6) we find that people judge machine actions primarily by their perceived harm, but judge hu- man actions by the interaction between perceived harm and intention. This principle explains many of the differences observed in this book, as well as some earlier findings, such as people’s preference for utilitarian morals in machines.
The second principle is that people assign extreme intentions to humans and narrow intentions to machines.
-
Wildfires continue to burn in the western United States. The New York Times provides a tracker showing the ones burning now, along with air quality and a smoke forecast.
A couple of weeks ago, it smelled of smoke in my area and the sky was orange. I guess this is the new norm.
-
Noah Veltman fed an AI movie descriptions and made it generate images. The results are in quiz form so that you can guess the movies. I would give myself a poor rating for guessing the movies, but once you see the answer, you’re like oh yeah of course.
Veltman used VQGAN+CLIP, which you can find out more about here.
-
Chris Yu, Henrik Schumacher, and Keenan Crane from Carnegie Mellon University are working on repulsive curves, which is a method to efficiently unravel curves so that they don’t overlap:
Curves play a fundamental role across computer graphics, physical simulation, and mathematical visualization, yet most tools for curve design do nothing to prevent crossings or self-intersections. This paper develops efficient algorithms for (self-)repulsion of plane and space curves that are well-suited to problems in computational design. Our starting point is the so-called tangent-point energy, which provides an infinite barrier to self-intersection. In contrast to local collision detection strategies used in, e.g., physical simulation, this energy considers interactions between all pairs of points, and is hence useful for global shape optimization: local minima tend to be aesthetically pleasing, physically valid, and nicely distributed in space.
Be sure to watch the video demo.
-
[arve url=”https://www.youtube.com/watch?v=akZ8JJ4gGLs” loop=”no” muted=”no” /]
Matt Henderson on Numberphile shows off a “lightning algorithm” which is actually a maze-solving algorithm that shows the solution at the end. Come for the demo at the beginning but stay for the explanation.
-
Members Only
-
This is a 24-hour snapshot for a day in the life of Americans.
-
[arve url=”https://www.youtube.com/watch?v=5q87K1WaoFI” loop=”no” muted=”no” /]
For their 5 Levels series, Wired brought in Hilary Mason to explain machine learning at five levels of difficulty. Mason’s explanations are super helpful at every level.
-
Robert Gebeloff, Denise Lu and Miriam Jordan for The New York Times looked at overall increases and variation within the Asian population:
North Dakota, South Dakota, Texas, North Carolina and Indiana are among states that experienced major growth in the past decade. And people of Asian descent have been settling in ever larger numbers in states like West Virginia, where the overall population has declined.
-
For NYT Opinion, Josh Bivens and Stuart A. Thompson argue that you don’t need to panic about inflation:
It may surprise many Americans that even during times of strong growth and very low inflation (like the late 1990s) or weak growth and low inflation (like the years following the Great Recession), more than half of all goods and services are usually experiencing price increases. In part, this is because it is awfully hard for employers to cut nominal wages, even in a recession. And economists see some mild, steady economy-wide inflation as a sign of a healthy economy. The Fed, for instance, actively targets an average overall inflation level of 2 percent per year.
I like the mini visual cues in the body text so that you don’t have to scroll or refer back to the full chart to see what they’re talking about.
-
With professional basketball, we often hear about carry jobs. There’s one star player who carries everyone else to a championship. Russell Goldenberg for The Pudding looked for the biggest carry jobs in NBA Finals history.
-
Members Only
-
After looking at how much time we spent on daily activities in 2020, let’s look at when we spent our time.
-
Generative art seems to be having a moment right now, so it’s only appropriate that there’s an R package to help you make some. The aRtsy package by Koen Derks makes algorithms more straightforward to use. Set parameters and you’re off.
-
We see percentages for the vaccinated and unvaccinated, and people can easily misinterpret or miscommunicate the results. It’s especially problematic when people are actively trying to confirm misconceptions. For The New York Times, Lauren Leatherby tries to make things clearer imagining two groups: one that is 20% vaccinated and one that is 95% vaccinated.
Vaccines work.
-
Using unit charts, NPR shows the number of people who identify with each race or ethnicity:
[A] different kind of breakdown can show how racial groups are becoming more heterogeneous. This graphic shows the number of people who said they identified with each race, regardless of how many races they chose. For example, if a person said they identified as Black and Asian, they would appear in both racial categories.
-
CNN goes with the dot density map for their first pass on the 2020 decennial. Each dot represents a certain number of people depending on your zoom level. Color represents race or ethnicity.
Does CNN have a limited color palette that they’re allowed to use? I would’ve gone for more contrast between the light blue for white and darker-but-still-light blue for American Indian/Alaskan Native.
See also: Dustin Cable’s racial dot map from 2013 and Erica Fischer’s dot maps of the same flavor from 2010.
-
The New York Times go with the angled arrows to show the shifts in racial population. The red-orange arrows show an increase in the share of white population, and the teal arrows show an increase in the share of people of color. Longer arrows mean a greater percentage point change.
Whereas The Washington Post focused more on the changes for each demographic individually, NYT focused more on how two broad groups compared.