The administration ordered a ban on methods that allow statistical agencies to publish…
uncertainty
-
Administration orders for less detailed census data
-

Pressure, a high-stakes movie about weather forecasting and uncertainty
It appears there is an upcoming film, Pressure, whose meteorologist main character deals…
-
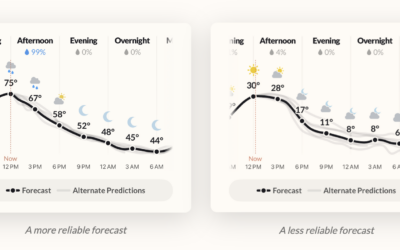
Weather forecast app, with uncertainty as a core feature
The folks who made Dark Sky, my once go-to weather app that was…
-
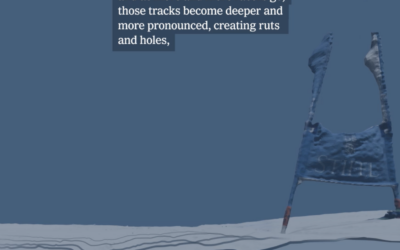
Why the best skiers don’t always win in the Olympics
Olympic gold medalist Ted Ligety is on the New York Times to explain…
-
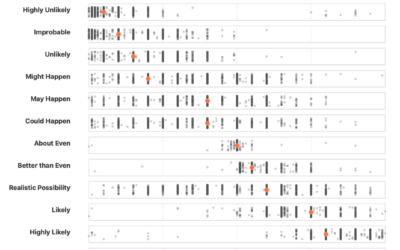
Your interpretation of uncertainty language compared
Probability expressed as a percentage is a value between 0% and 100%. If…
-
Decisions without data
For Bloomberg, Jarrell Dillard and Michael Sasso report on the effects of the…
-
Lack of data during the shutdown, globally
While the government shutdown pauses data about the United States, other countries feel…
-
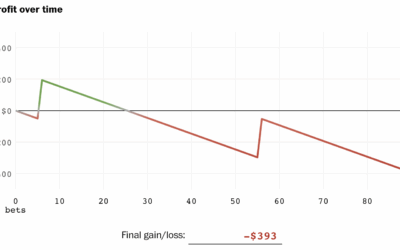
Odds against you in sports parlays, advantage house
Parlays in sports betting are booming and people are losing billions of dollars…
-
LLM “hallucinations” are mathematically impossible to avoid
From Gyana Swain for Computerworld on how “hallucinations” a.k.a. computer errors are inevitable…
-
Trust and transparency in government data
Speaking of the BLS, economist David Wessel joins Jonathan Schwabish on the PolicyViz…
-
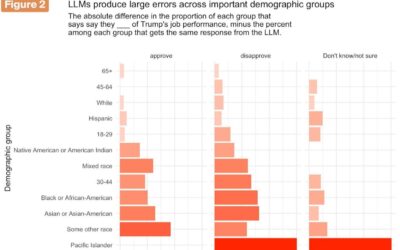
Real polling asks real people, unlike synthetic sampling
Synthetic sampling uses models to “survey” fake respondents. G. Elliott Morris and Verasight…
-
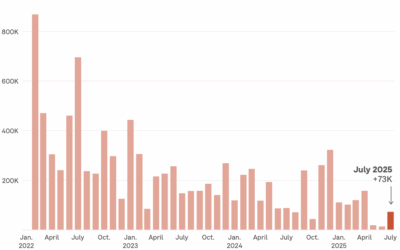
Job growth revised by -911,000
The Bureau of Labor Statistics revised job counts down by almost a million:…
-
Reliability of jobs data
The Bureau of Labor Statistics released monthly jobs data, but after the firing…
-
When other countries shunned their data and statisticians
For the New York Times, Ben Casselman highlights the potential repercussions for shunning…
-
Commissioner of Labor Statistics fired, because labor statistics were not to president’s liking
The administration disagreed with the jobs count released by the Bureau of Labor…
-
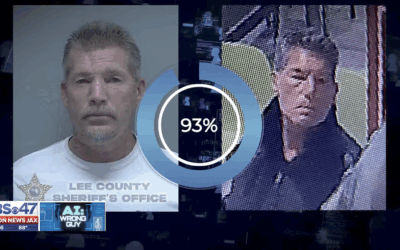
Misidentified by facial recognition and arrested
In Jacksonville, Florida, police arrested a man because AI facial recognition classified his…
-
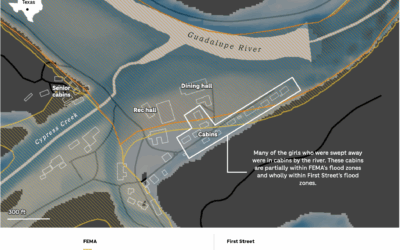
FEMA flood risk vs. more comprehensive estimates for Camp Mystic
Risk estimates change by statistical model and what that model accounts for. The…
-

Illustrated guide to card counting and investing
The internet continues to feed my compulsion to click on anything that mentions…
-
Members Only

Partial Data Reflections
This week, I have a new tutorial for you and then we get into using data with baggage.
-

Probability does not exist
Probability itself is an expression of uncertainty, but the calculations behind the percentages…
Recently for Members
Second Edition
 Visualize This: The FlowingData Guide to Design, Visualization, and Statistics (2nd Edition)
 Visualize This: The FlowingData Guide to Design, Visualization, and Statistics (2nd Edition)
New tools, refined process.
Browse by Chart Type See All →


