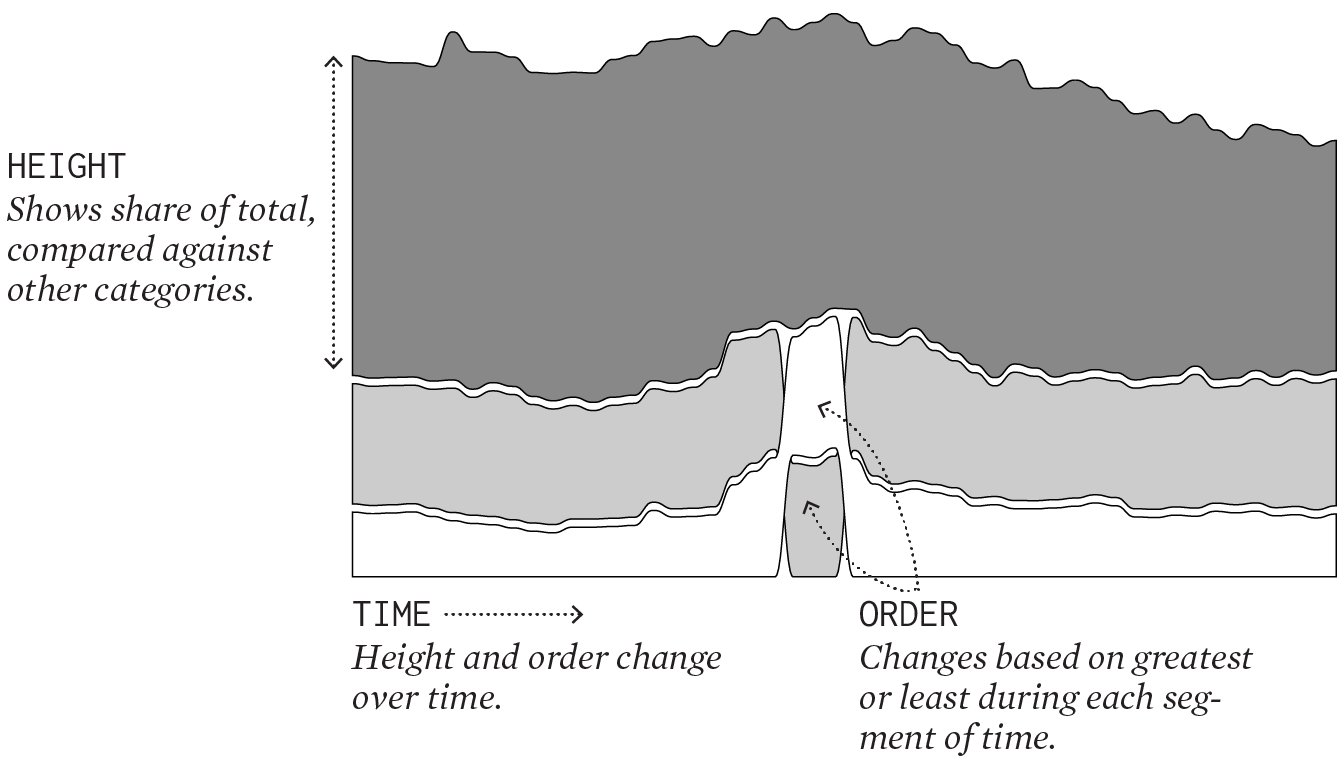
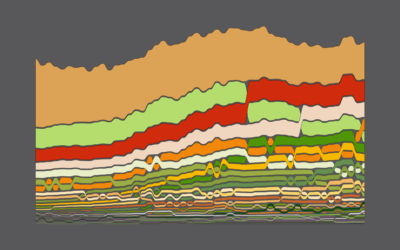
The flow chart type is useful for showing changes over time across categories. The geometry is similar to a stacked area chart but with spacing and order changes.
Here's how to do it in R from start to finish, plus editing in illustration software. Make design choices and trade-offs for more readable charts.
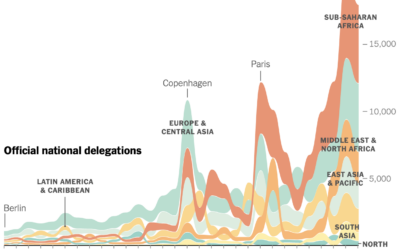
For the New York Times, Mira Rojanasakul visualized annual participation in the United…
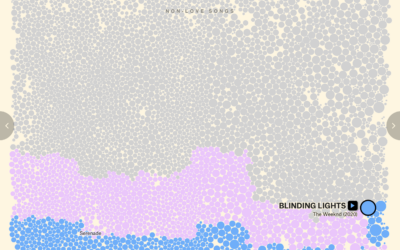
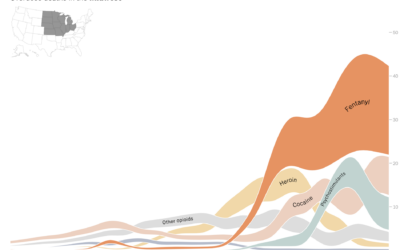
For The Pudding, David Mora and Michelle Jia examine the death of the…
Deaths by drug overdose in the United States increased sharply over the past…
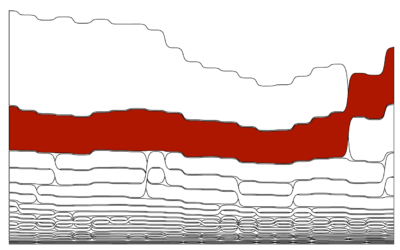
Speaking of data projects in unexpected places, David Mora repurposed one of my…
Among 1- to 19-year-olds, regulations decreased motor vehicle deaths, but deaths by firearms increased and became the leading mechanism in 2018.
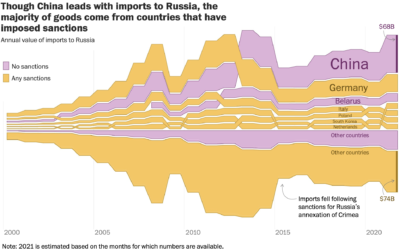
For The Washington Post, Andrew Van Dam, Youjin Shin and Alyssa Fowers plotted…
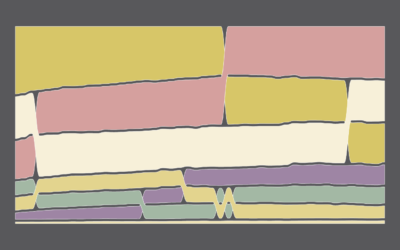
In the 1970s, the most common household type in the U.S. was a married couple with kids. Things are different now.
How long will chicken reign supreme? Who wins between lemon and lime? Is nonfat ice cream really ice cream? Does grapefruit ever make a comeback? Find out in these charts.
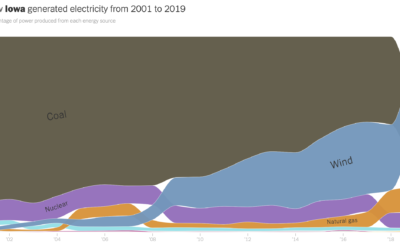
The way we make electricity in America is changing. For The New York…
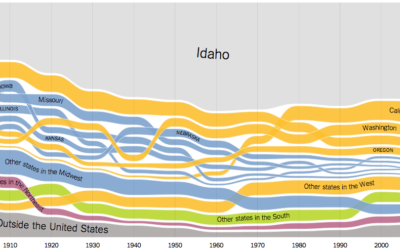
We’ve seen migration within the United States before, but Gregor Aisch, Robert Gebeloff,…