Visualising Knowledge is an open book from PBL Netherlands Environmental Assessment Agency, based on 25 years of making charts:
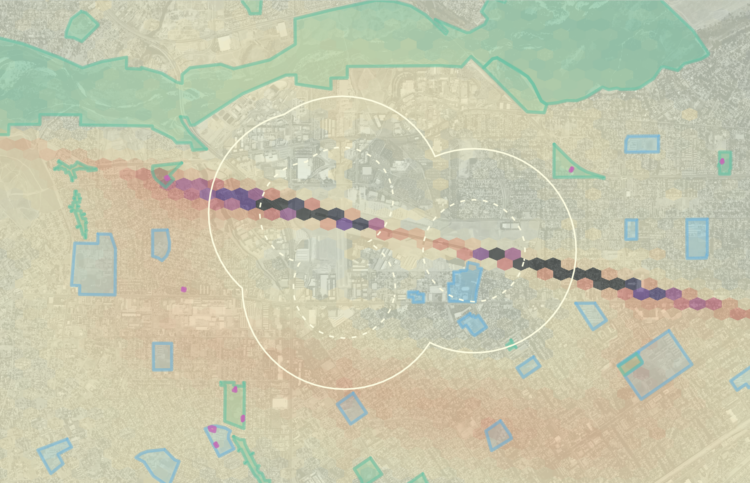
PBL data visualisation is about visualising research results, using graphs, maps, diagrams and infographics. Over the years, the variety in types of visualisation formats has greatly increased. In addition, visualisations have to be presented in an increasing number of different media: from figures in reports to interactive visualisations that are easy to read on smartphones and tablets.
The book ‘Visualising knowledge’ provides insight into how visualisations at PBL are created in a process of close collaboration between visualisation experts, researchers and communication experts, always keeping in mind both the medium and the target audience.
The original version is in Dutch, and they just published an English version. Download either version here.
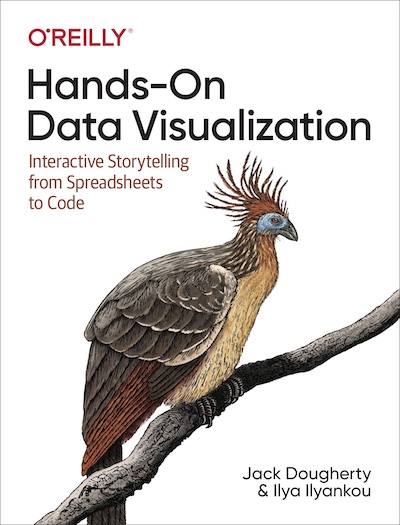
 Visualize This: The FlowingData Guide to Design, Visualization, and Statistics (2nd Edition)


