Cutting the national debt is a complex process that involves a lot more…
Nathan Yau
-
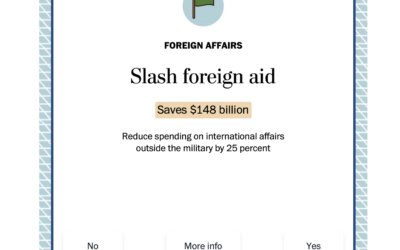
Swipe left or right to cut the national debt
-
Members Only
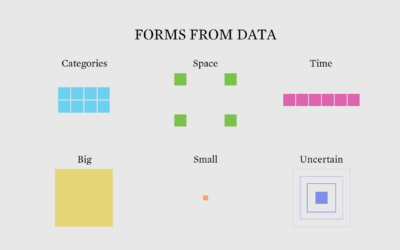
Chart Practice: Switching the Datasets
Same data brings out the same visual forms. So switch up the data that you look at.
-
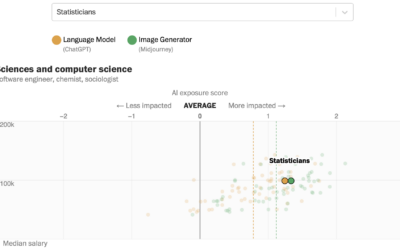
How much AI will affect your job
Research by Edward W. Felten, Manav Raj, and Robert Seamans provides estimates for…
-
Members Only
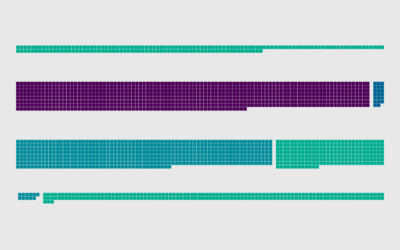
How to Make Unit-Based, Variable Width Bar Charts
In a cross between unit charts and variable width bar charts, we can show total counts and relative proportions at the same time.
-

Eurovision winners past and present
The 2023 Eurovision Song Contest finished up this past weekend with the winning…
-

A visual story about kimchi and family
Alvin Chang, for The Pudding, illustrated the search for his kimchi, which is…
-
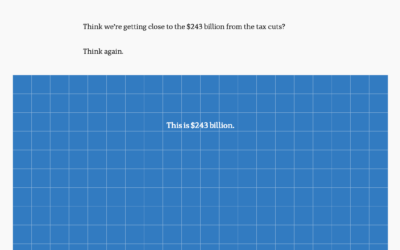
Scale of billions of dollars in Australia’s budget
To show the scale of tax cuts and Australia’s budget, ABC News takes…
-

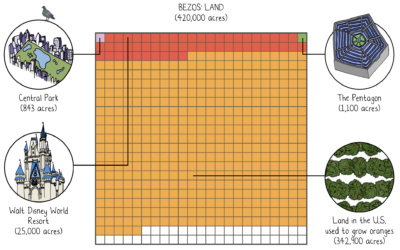
Population surrounded by interstate highways
Filed under random but fun calculations, Alasdair Rae estimated the number of people…
-
Members Only
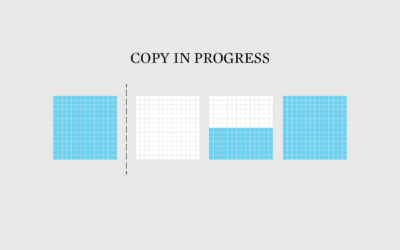
Chart Practice: Mimicking Others
One of the most straightforward ways to “do the thing” — and stay on the right track towards work you want to do — is to mimic projects that you like.
-

Best Possible Life More Common with Age
Maybe your best possible life is ahead of you.
-

Improved color palettes in R
Achim Zeileis and Paul Murrell provide a rundown of the more user-friendly color…
-
Mona Chalabi wins Pulitzer for data illustrations
Mona Chalabi, known around these parts for her illustrative approach to data journalism,…
-
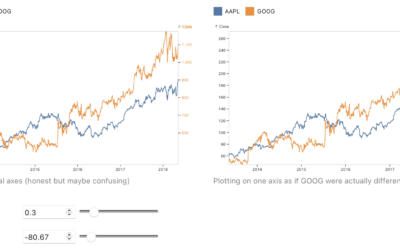
Arguing in favor of dual axes to show correlation
Charts that use two different scales on the same vertical often get the…
-
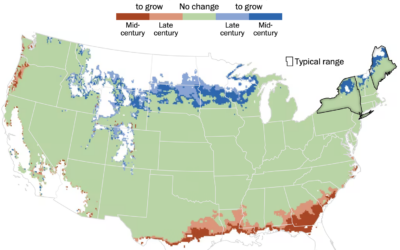
Mapping where trees will grow
As the climate changes, the places that different types of trees will grow…
-

Demonstrating how large language models work
You might’ve heard about large language models lately. They’re the “brains” behind recent…
-
Members Only
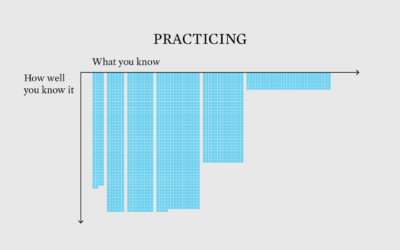
Chart Practice
Split it up into small pieces and then aim for depth.
-

Quantum computing visual explainer
Quantum computing promises a higher level of processing power over current computers, but…
-
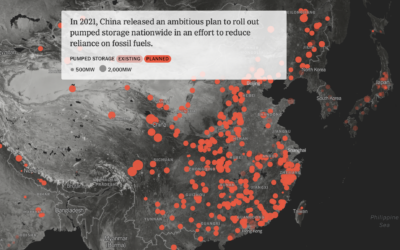
When you cross hydropower and a battery
Mira Rojanasakul and Max Bearak for The New York Times highlight the rise…
-
Chart Challenge for a Day
My schedule doesn’t really fit with the daily-thing-for-thirty-days genre of challenges. So my genius idea was to compress a 30-day challenge into one day.
-

Non-abstract Curry shot chart
Stephen Curry of the Golden State Warriors scored 50 points in game 7…
Recently for Members
Second Edition
 Visualize This: The FlowingData Guide to Design, Visualization, and Statistics (2nd Edition)
 Visualize This: The FlowingData Guide to Design, Visualization, and Statistics (2nd Edition)
New tools, refined process.
Browse by Chart Type See All →


