The administration closed Climate.gov last year during the takedowns, so a group formed…
climate
-
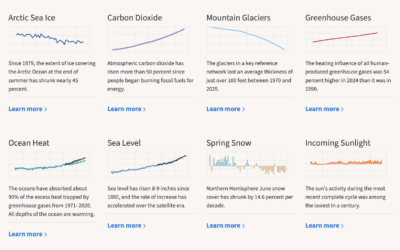
Climate.us, successor to Climate.gov, launches to the public
-
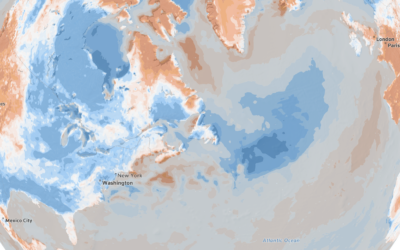
Comparing today’s temperature against historical averages
When you have that feeling that today is abnormally hot or cold for…
-
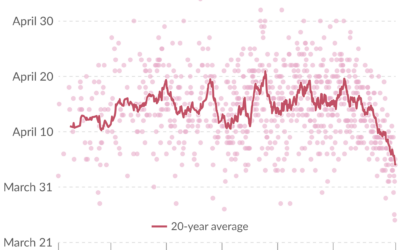
Continuing the cherry blossom data alive
Japanese officials and researchers have been carefully documenting when cherry blossoms bloom in…
-

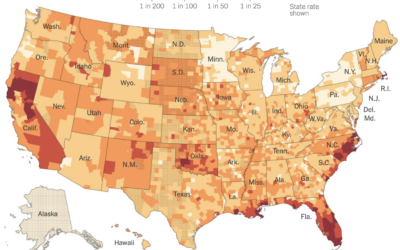
More homeowners turning to insurance last resort
Wildfires and hurricanes continue to grow more common, so insurance companies have more…
-
Zillow removed climate risk scores, because property-level modeling is not foolproof
When Zillow removed climate risk scores from property listings, many assumed the company…
-
Farmers sued the USDA over deleted data — and it worked
In February, farmers sued the U.S. Department of Agriculture for removing data related…
-
NOAA database for extreme weather disasters cancelled
The NOAA database, dubbed Billion-Dollar Weather and Climate Disasters, tracked events that exceeded…
-
USDA sued for removing climate data
Farming and environmental groups are suing the U.S. Department of Agriculture for removing…
-
Home insurance companies dropping customers
Because of a warming planet with more wildfires and hurricanes, it’s growing more…
-
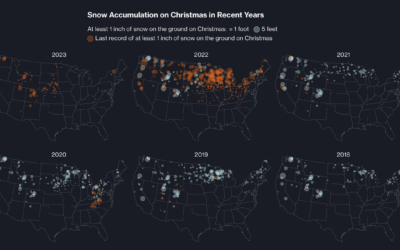
When cities last saw snow on Christmas
Christmas is coming. For some, that means snow on the ground, but as…
-
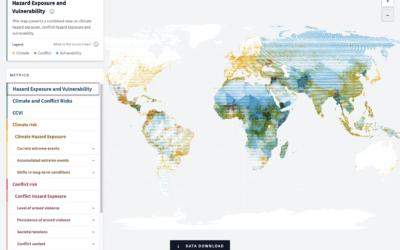
Scoring climate, conflict, and vulnerability around the world
In an effort to measure and highlight risks globally, the German Federal Foreign…
-
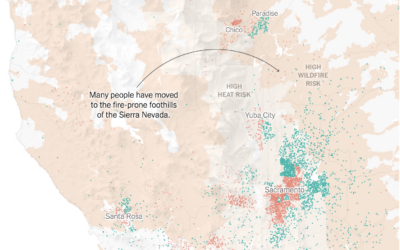
Maps showing migration out of cities
Mira Rojanasakul and Nadja Popovich, for The New York Times, mapped migration out…
-
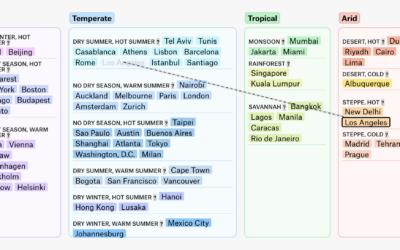
Changing climate zones of major cities
A global map of climate change can make a few degrees of rising…
-
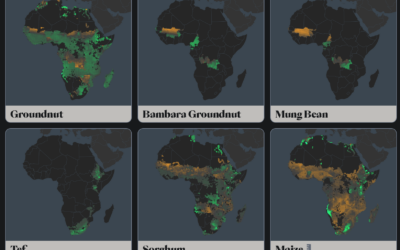
Mapping the crops with the most potential in a changing climate
The climate is changing, which means some crops will fair better or worse…
-
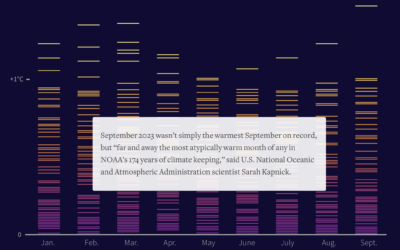
A hotter year, again
This year, 2023, was the hottest year on record. For Reuters, Gloria Dickie,…
-
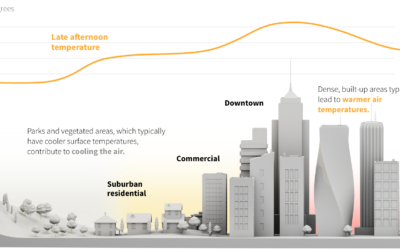
Hot surfaces, stored energy
In hot places, the ground can heat to higher temperatures than the air,…
-
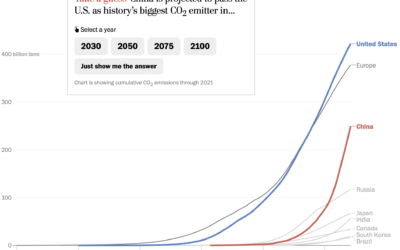
Line chart race to show emissions
For The Washington Post, Harry Stevens used the line chart equivalent of a…
-
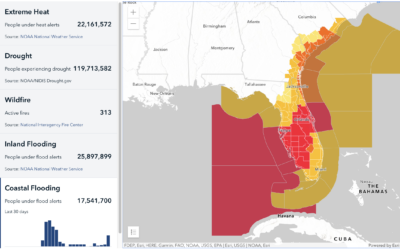
Mapping climate-related hazards in real-time
Bringing in data from various federal agencies:
Climate Mapping for Resilience and Adaptation… -
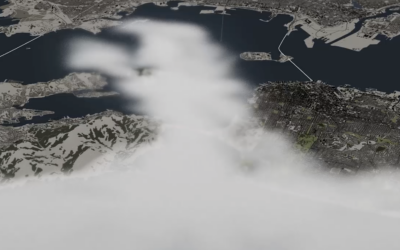
Climate and the San Francisco fog
A reliable dense fog in San Francisco is a defining characteristic of the…
-

Welcome to Meltsville
It’s getting hot in cities around the world, each city with its own…
Recently for Members
Second Edition
 Visualize This: The FlowingData Guide to Design, Visualization, and Statistics (2nd Edition)
 Visualize This: The FlowingData Guide to Design, Visualization, and Statistics (2nd Edition)
New tools, refined process.
Browse by Chart Type See All →


