In a 2005 paper “If I look at the mass I will never…
-
Decision-making with big numbers we can’t really see
-
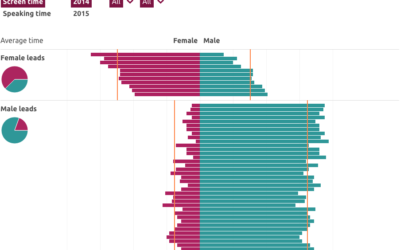
Computed screen time for men and women
In a collaborative effort, the Geena Davis Institute on Gender in Media computed…
-
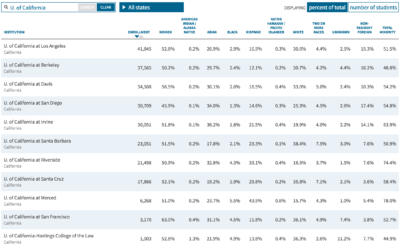
Diversity percentages for US schools
Based on 2014 estimates from the U.S. Department of Education, the Chronicle of…
-
Mississippi drainage
Horace Mitchell for NASA’s Scientific Visualization Studio mapped the massive drainage basin that…
-
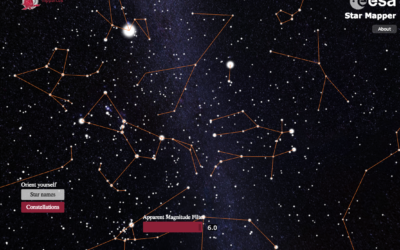
Explore the stars with this interactive Star Mapper
Jan Willem Tulp, in collaboration with the European Space Agency, produced the ESA…
-
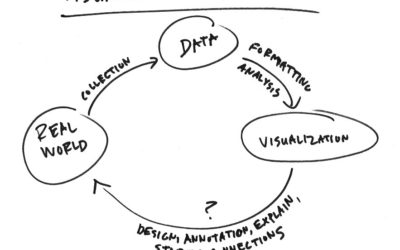
Shorten the Visualization Path Back to Reality
Visualization is complex, but if I were to break it down simply, I’d…
-
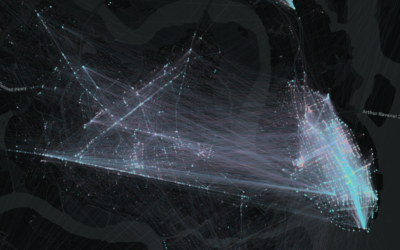
Police surveillance in a digital world
Glenn Smith and Andrew Knapp for the Post and Courier investigate the current…
-
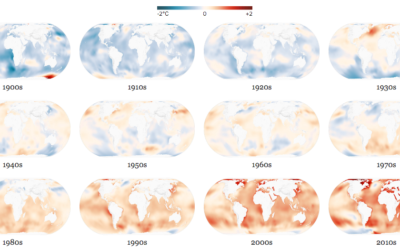
Oceans absorbing heat
It keeps getting hotter on this planet, and the oceans are absorbing most…
-
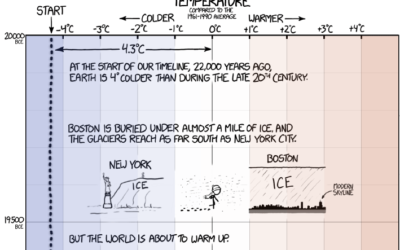
xkcd: Earth temperature timeline
In classic xkcd-fashion, Randall Munroe timelines the Earth’s temperature, dating back to 20,000…
-

Innovation by Design Awards
Co.Design picked the winners for their annual Innovation by Design Awards. My series…
-

Watch bacteria evolve resistance to antibiotic
Scientists at Harvard University setup the MEGA-plate, essentially a giant petri dish, with…
-
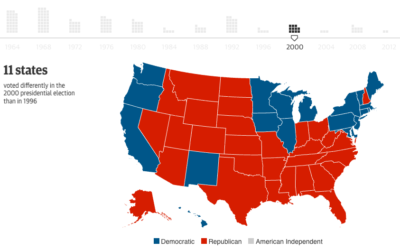
Swing states are a relatively new thing
Here’s a fun one from the Guardian. They go over the change in…
-
Election DataBot provides a feed of the interesting data stories
There is a ton of election-related data pushed out every day, so much…
-
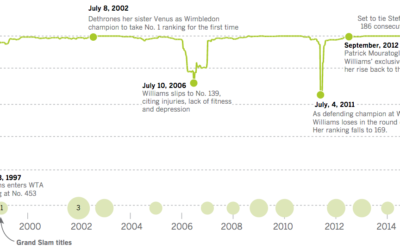
Serena Williams, greatest of all time
Serena Williams, who plays tonight in the U.S. Open semifinal, might be the…
-
Members Only
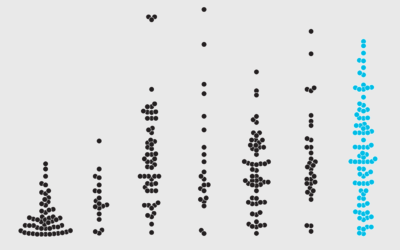
How to Make Beeswarm Plots in R to Show Distributions
Try the more element-based approach instead of your traditional histogram or boxplot.
-
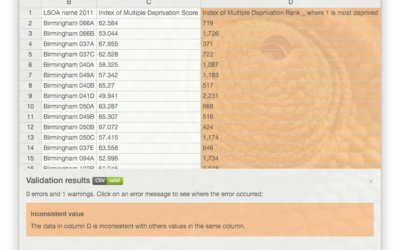
Comma Chameleon, a stripped-down CSV editor
CSV files are great, but every now and then you have to edit…
-
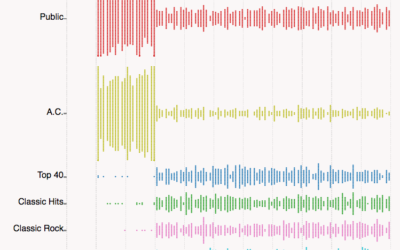
Radio station frequencies, by genre
In most areas in the United States, lower FM frequencies are reserved for…
-
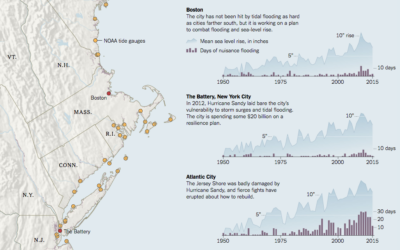
More global warming, more flooding
Water levels are rising, and naturally, the coasts are feeling it. Jonathan Corum…
-
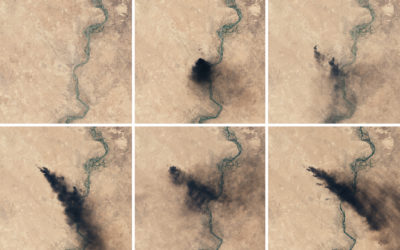
Oil fires in Iraq seen from above
Though far away, there’s still a lot you can see, as the NASA…
-
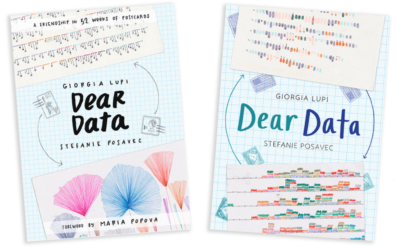
Dear Data, the book
For a year, Stefanie Posavec and Giorgia Lupi drew data postcards and sent…
Recently for Members
Second Edition
 Visualize This: The FlowingData Guide to Design, Visualization, and Statistics (2nd Edition)
 Visualize This: The FlowingData Guide to Design, Visualization, and Statistics (2nd Edition)
New tools, refined process.
Browse by Chart Type See All →


