Gerrymandering continues to be an important thread that I think many people still…
Nathan Yau
-
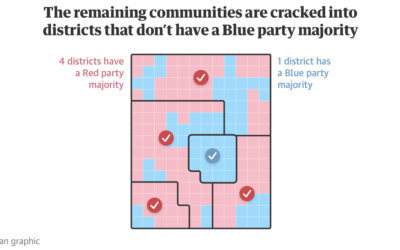
Visual guide to redistricting
-
How We Spent Our Time in 2020 Versus 2019
Our everyday routines changed over the past year, and with the 2020 American Time Use Survey, we can see by how much.
-
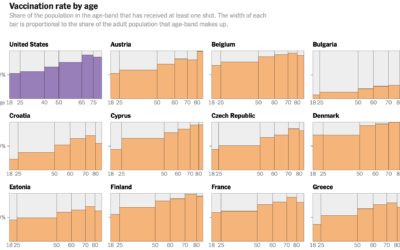
Decline of U.S. vaccination rate compared against Europe’s
Elian Peltier and Josh Holder for The New York Times highlight the vaccination…
-
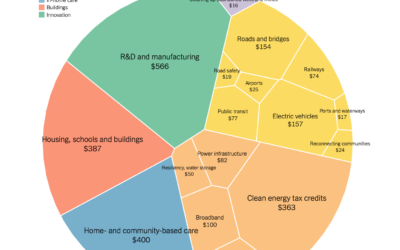
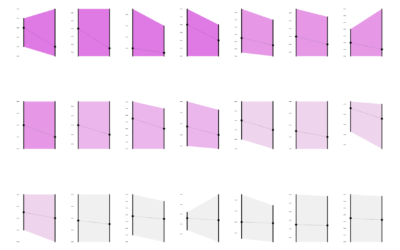
Comparison of Biden infrastructure plan and updated bipartisan plan
Aatish Bhatia and Quoctrung Bui for NYT’s The Upshot made the comparison using…
-
Members Only
Visualization Tools and Learning Resources, July 2021 Roundup
Here’s the good stuff for July.
-

Counting Happiness and Where it Comes From
Researchers asked 10,000 participants to list ten things that recently made them happy. I counted and connected the dots.
-
An AI chatbot to talk to the dead
Joshua Barbeau fed an AI chatbot with old texts from his fiancee who…
-
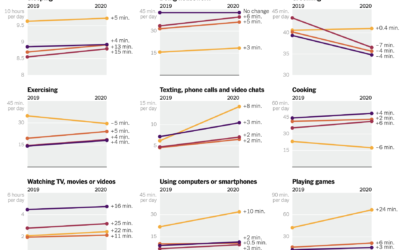
How time use changed in 2020
Ben Casselman and Ella Koeze for The New York Times compared time use…
-
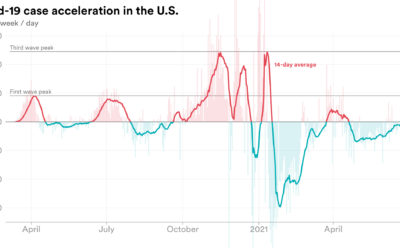
Rate of change in Covid-19 cases
We’re all familiar with the Covid-19 line charts that show cases over time,…
-
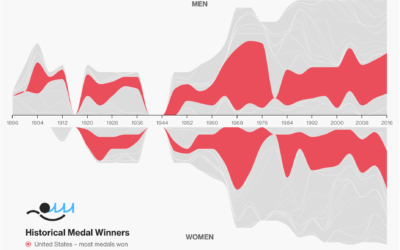
Olympic medal tracker
The Bloomberg medal tracker is fun to look at. I think the graphics…
-
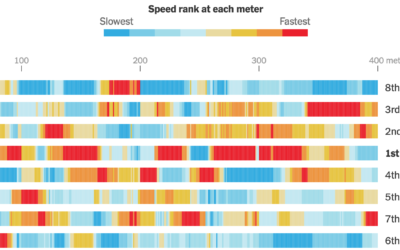
Calculating swim speeds
The New York Times charted speed ranks during the women’s 4×100 freestyle relay.…
-

New Olympic sports explained
The 2020 Summer Olympics are here, so ’tis the season for experimental visual…
-
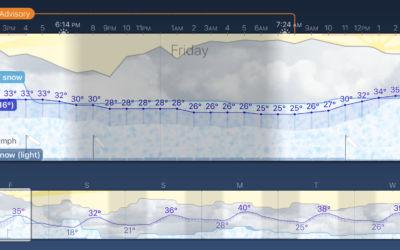
Weather Strip, an app that shows the forecast as a time series
Weather Strip is a new weather app by visualization researcher Robin Stewart. It…
-
Members Only
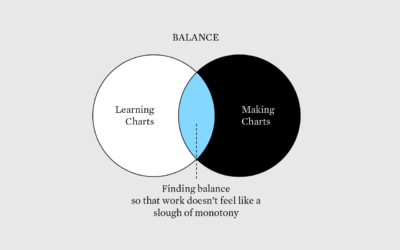
Learning New Visualization Things Practically – The Process 149
Learn about new visualization things, but also get actual work done.
-

Olympic event visual explainers
With the Olympics starting on Friday, The New York Times started their coverage…
-
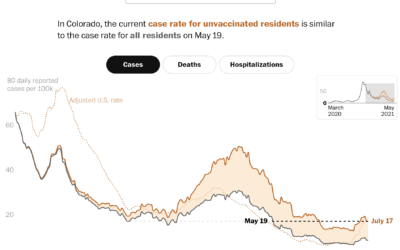
Case rates adjusted for the unvaccinated
Covid-19 cases in the United States were down, but they’re moving up again,…
-
Introduction to Deep Learning
Sebastian Raschka made 170 videos on deep learning, and you can watch all…
-
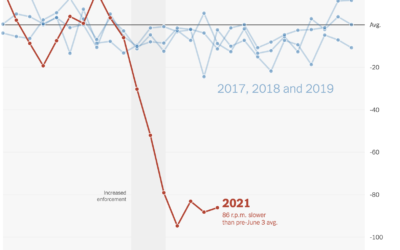
Falling spin rates in baseball after rule enforcement
NYT’s The Upshot analyzed spin rate on pitches before and after enforcing a…
-
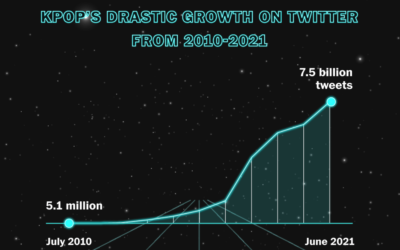
Rise of K-pop
K-pop seems to be inescapable these days, which really confuses me. Marian Liu,…
-
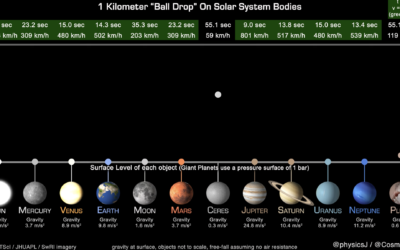
How long it takes a ball to drop on various Solar System bodies
James O’Donoghue made this straightforward animation that shows how long it takes for…
Recently for Members
Second Edition
 Visualize This: The FlowingData Guide to Design, Visualization, and Statistics (2nd Edition)
 Visualize This: The FlowingData Guide to Design, Visualization, and Statistics (2nd Edition)
New tools, refined process.
Browse by Chart Type See All →


