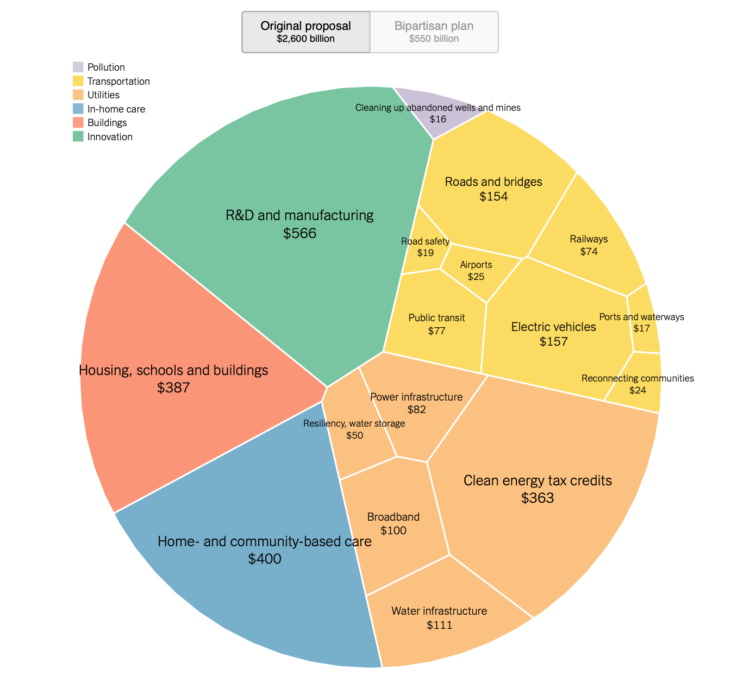
Aatish Bhatia and Quoctrung Bui for NYT’s The Upshot made the comparison using a circular Voronoi treemap. The fills flip between the original plan from March and the recently proposed plan, which is much smaller.
It takes me back to Amanda Cox’s consumer spending graphic from 2008, which no longer works, because Flash.


 Visualize This: The FlowingData Guide to Design, Visualization, and Statistics (2nd Edition)