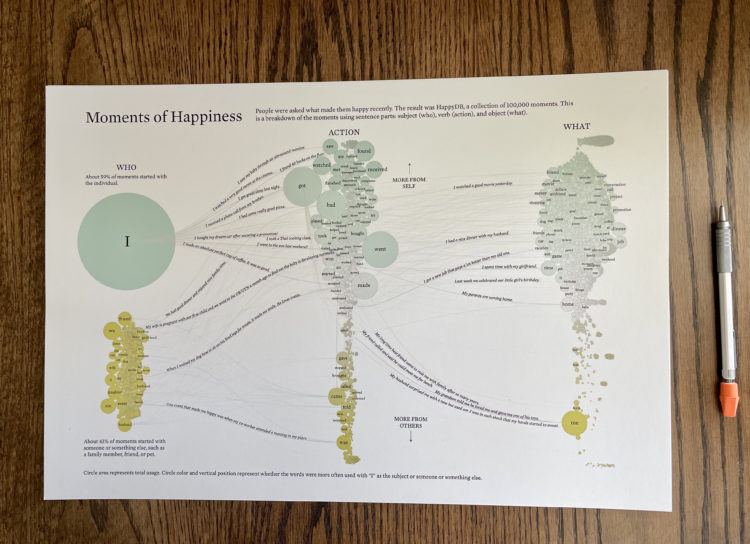
Counting Happiness and Where it Comes From
Researchers asked 10,000 participants to list ten things that recently made them happy. The result was HappyDB, a collection of 100,000 happy moments. For each moment, I parsed out the subject, verb, and object to better see what makes people happy overall.
For example, someone might have said “I watched a good movie yesterday.” The subject was “I”, the verb was “watched”, and the object was “movie”.
Then I counted and connected the dots.
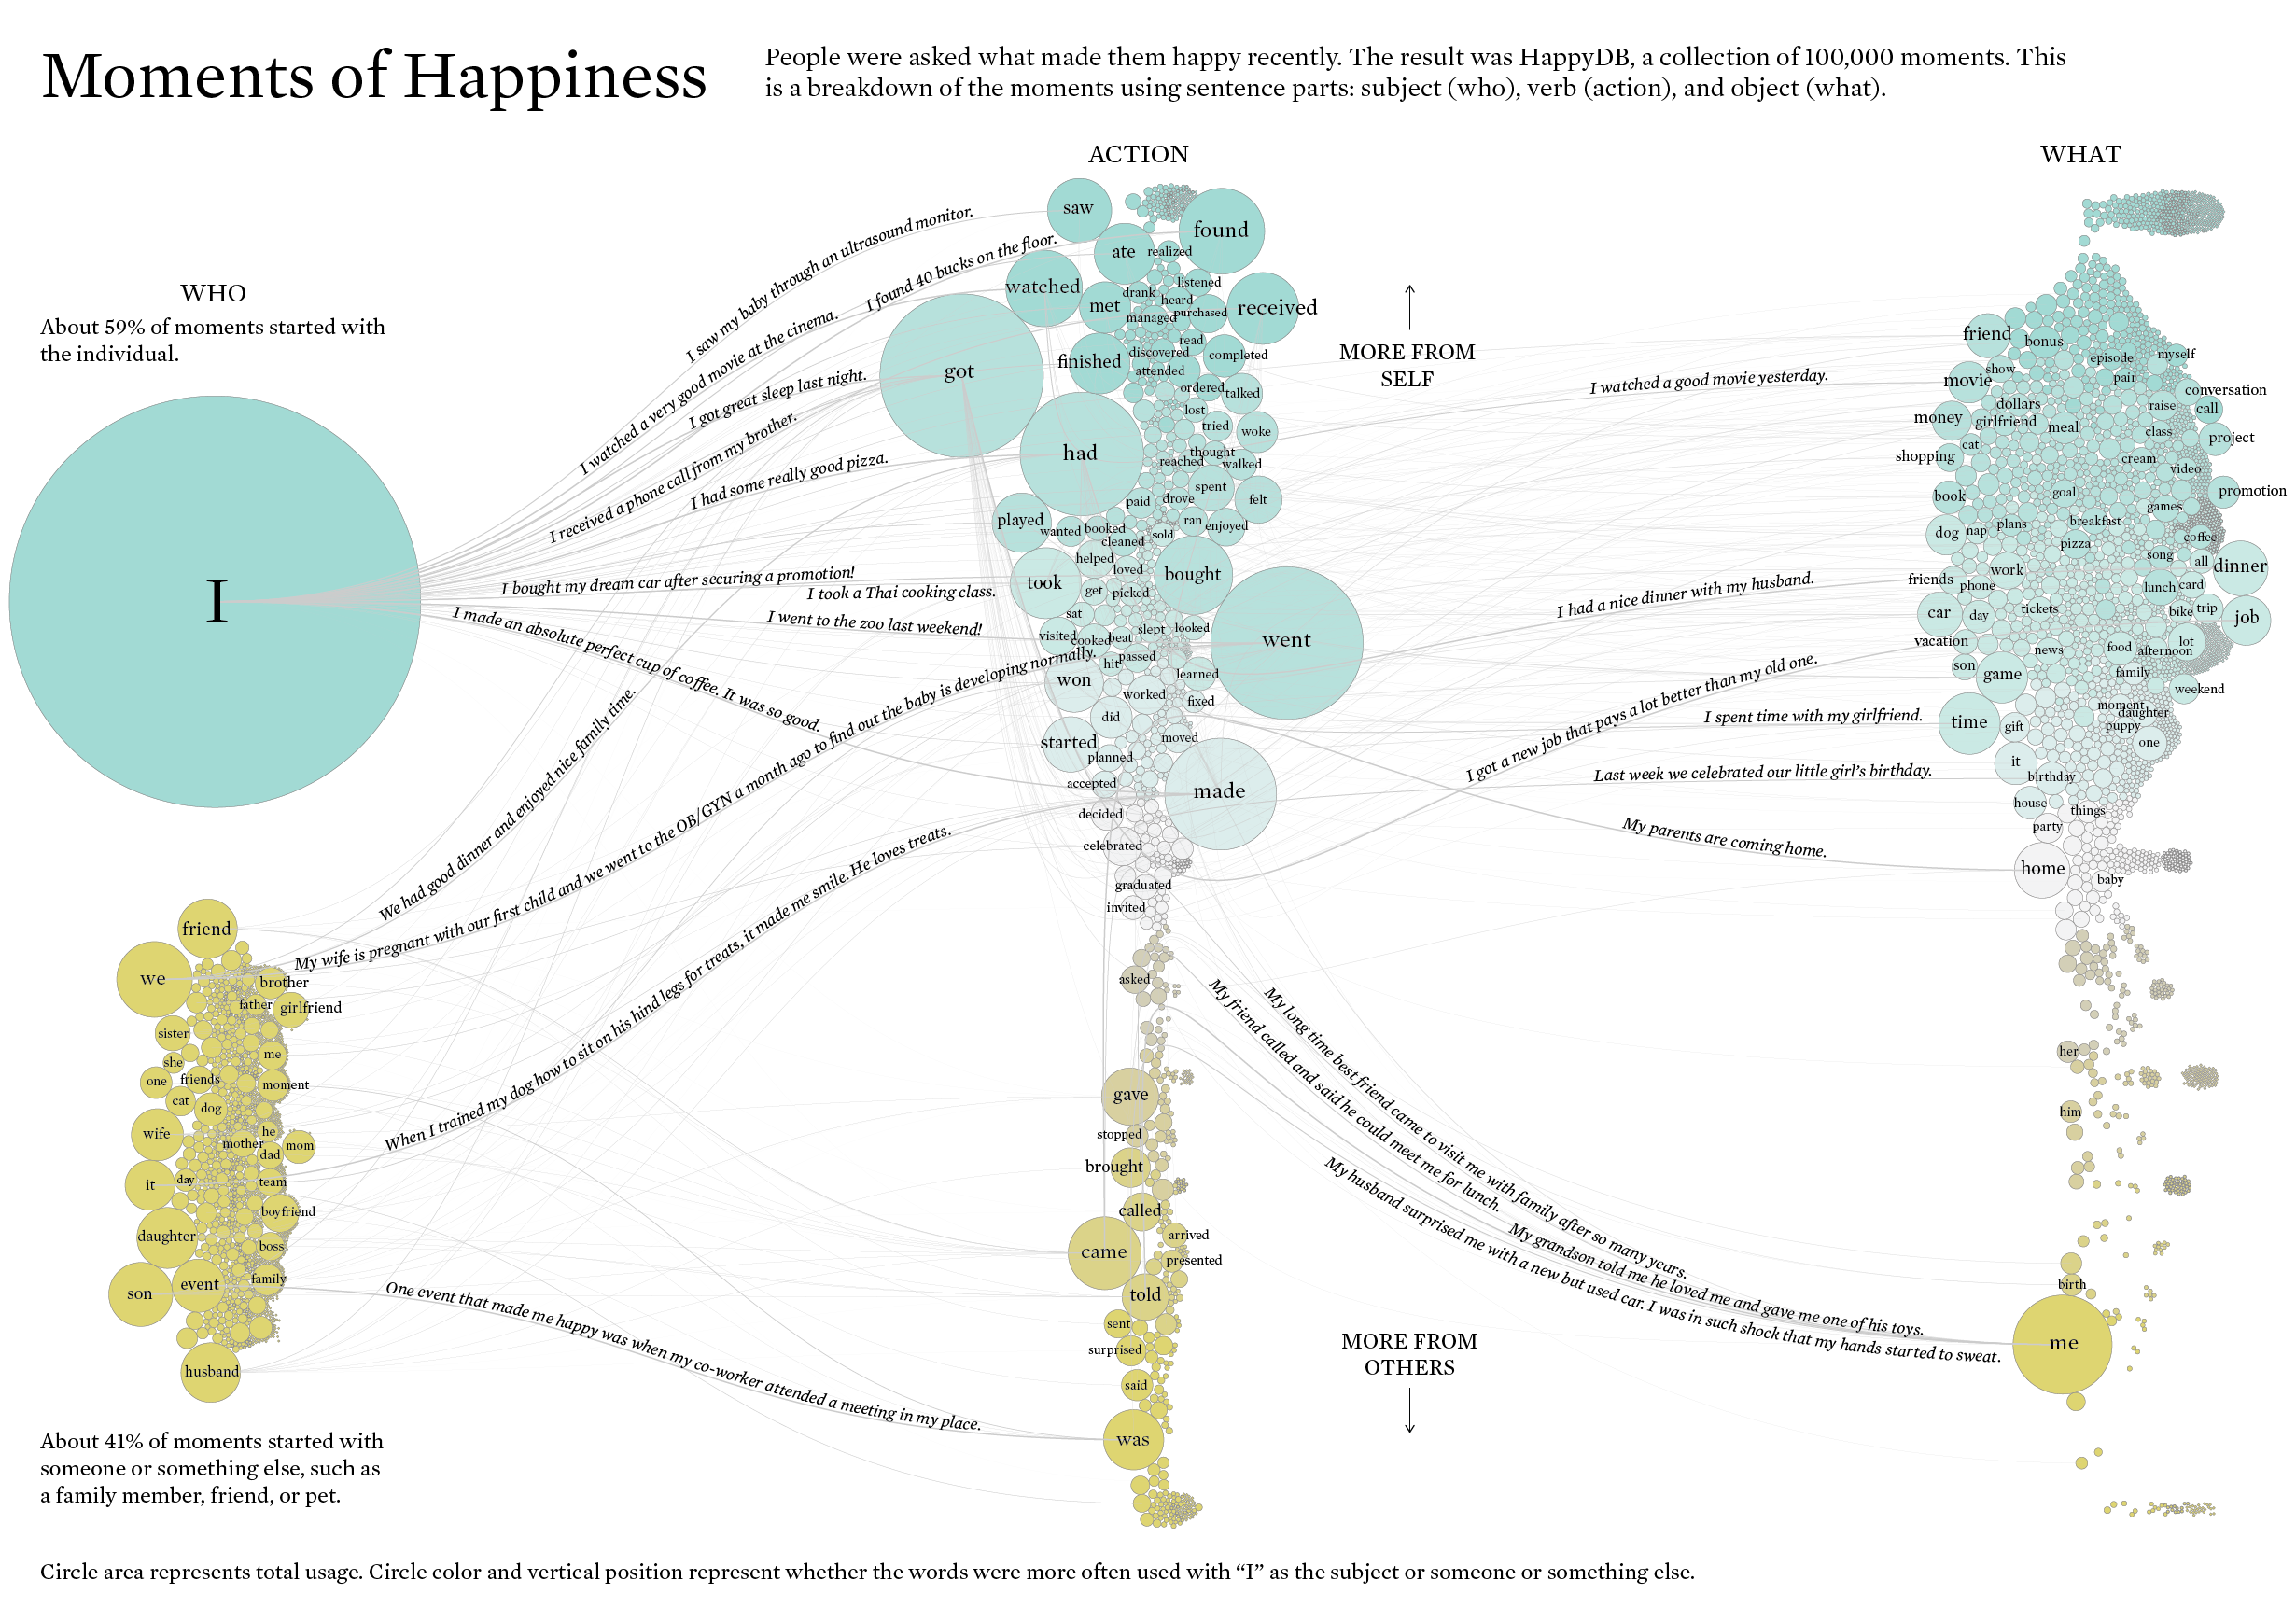
From my previous analysis, I knew the subject part of the moments was split between “I” and everything else, so it seemed reasonable to look at happiness that started with the self versus happiness that came from others. There’s a difference between “I ate some good pizza.” and “My parents are coming home.” It’s the difference between what we do to make ourselves happy and what we do to make others happy.
Here are the top five subject-verb-object combinations from each group:
Subject / Verb / Object with “I”
- I / had / dinner
- I / watched / movie
- I / got / job
- I / spent / time
- I / had / lunch
With Others
- Team / won / game
- Husband / surprised / me
- Son / gave / hug
- Friend / told / me
- Husband / came / home
The team-won-game surprised me at first, but it’s mostly people who were happy their favorite sports team won a game. Some moments were parents happy their child’s team won a game.
There’s overlap between the categories, so it seemed worth looking at the distributions only for moments with other people.
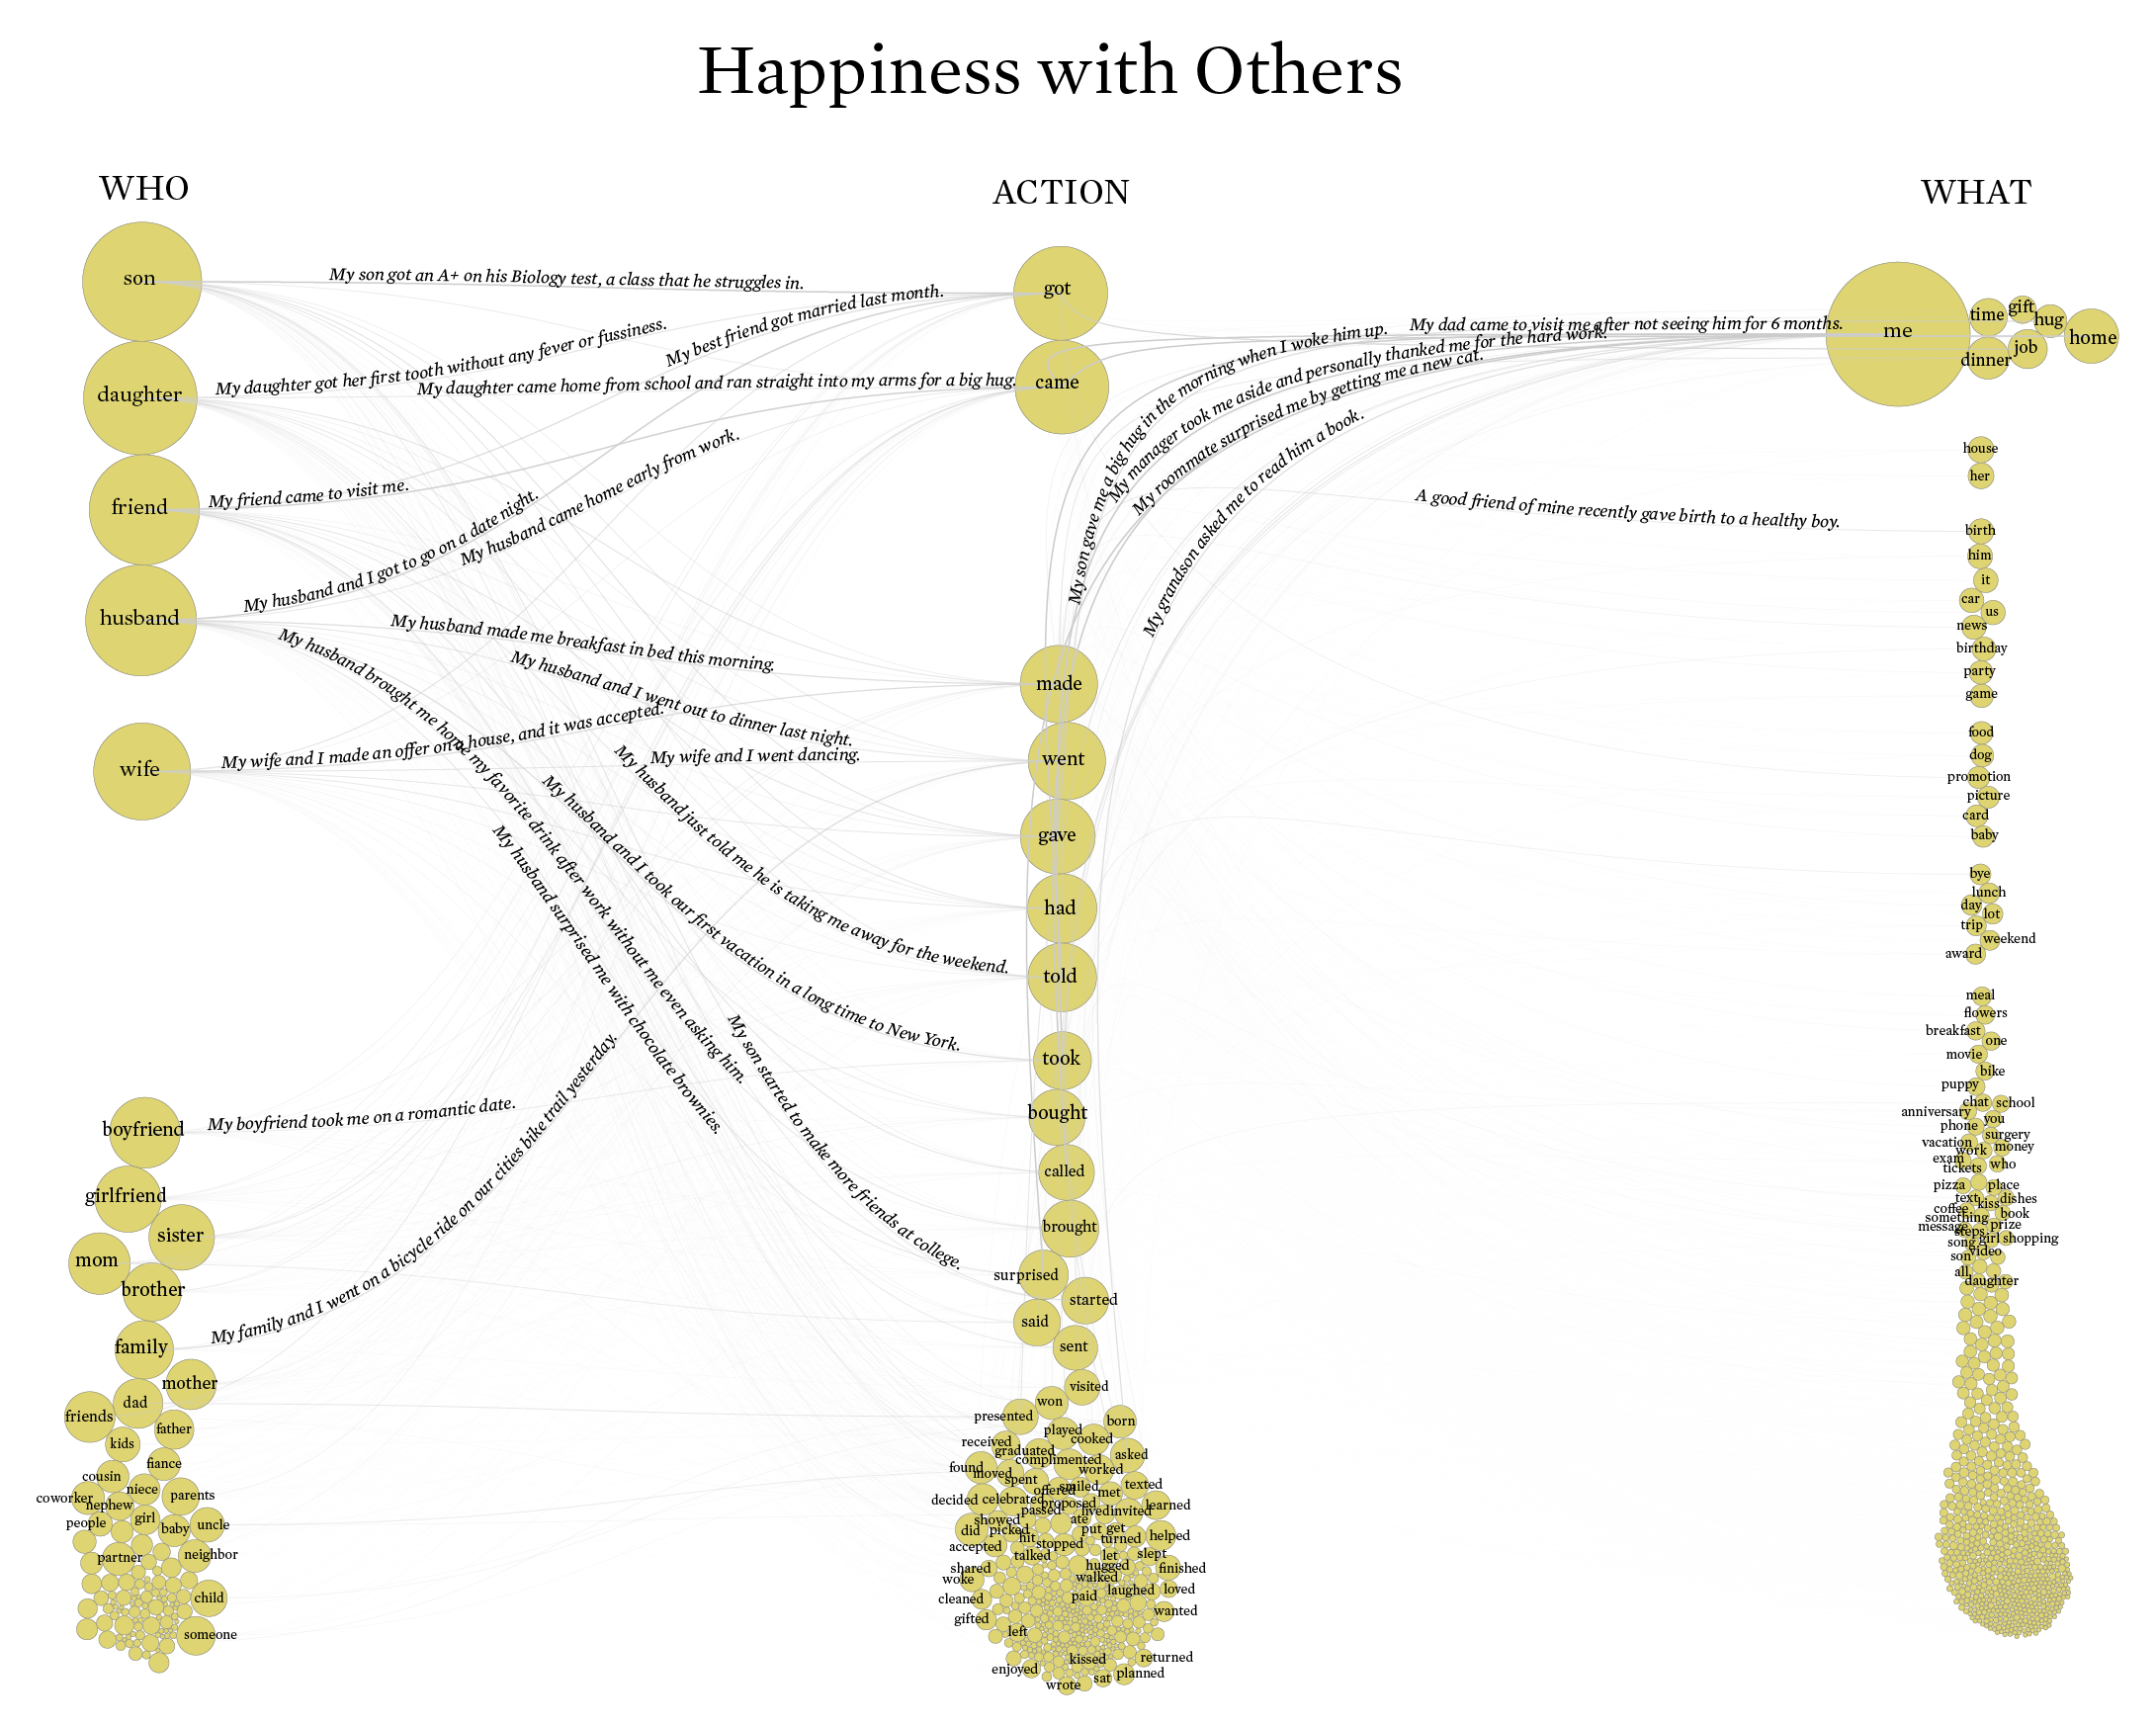
Again, the data was collected through Mechanical Turk, which isn’t a representative sample of the population. A large majority of participants were between 20 and 40 years old, which increases the counts for children and spouses. If the sample skewed younger, I suspect we’d see more “girlfriend” and “boyfriend” responses. I’d also expect to see more work-related people, but maybe those on Mechanical Turk are less likely to have a full-time boss, manager, or coworker.
The distribution of verbs (action) and objects (what) seems more interesting here. Generally speaking, it’s about someone making time for another, which might come as a meal together, a gift, or a hug.
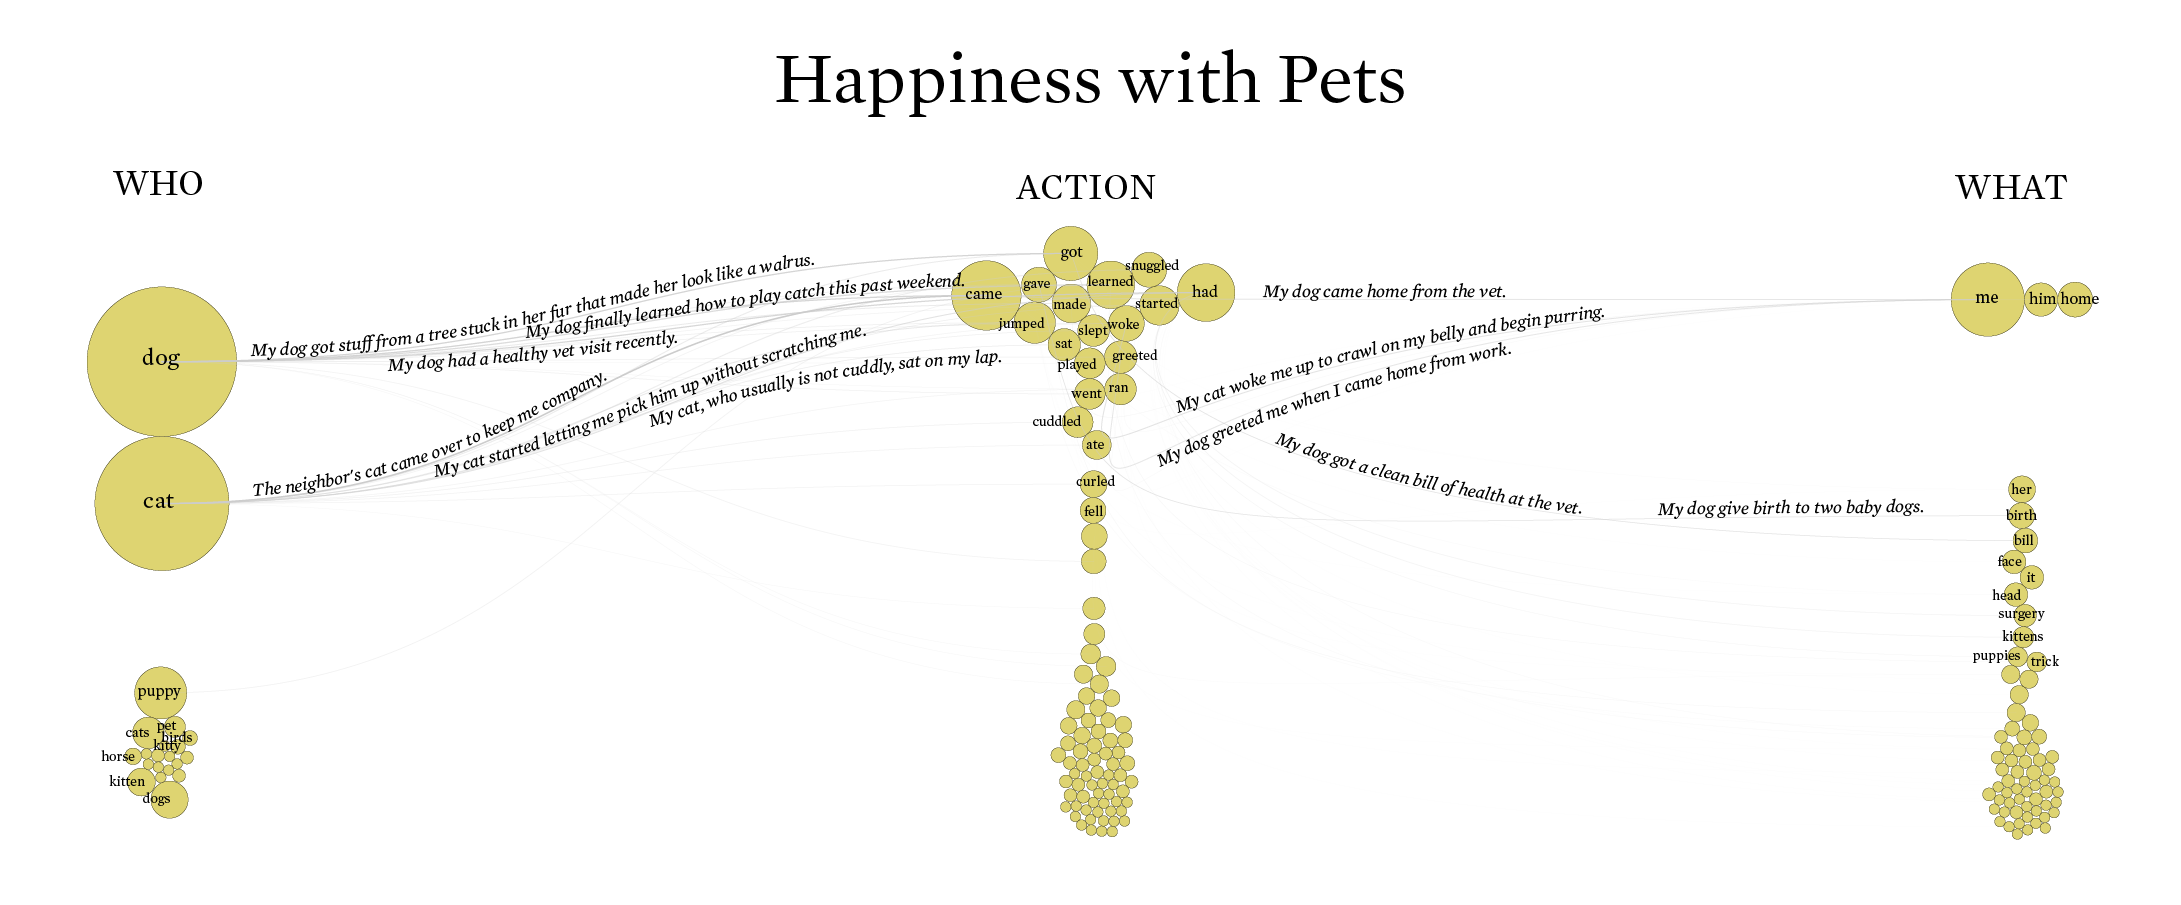
When you look at the breakdown for pets, the actions become more specific: snuggled, jumped, curled, etc. Dogs and cats are expectedly at the top.
In a nutshell, happiness comes in many forms, from many places, and through many paths. Sometimes you have to refocus your attention to see the moments more clearly.
Notes
- The data comes from HappyDB.
- I made the graphics using R and Adobe Illustrator.
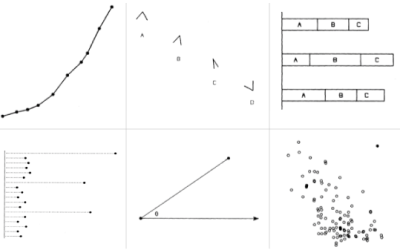
Chart Type Used

Become a member. Support an independent site. Get extra visualization goodness.
See What You Get