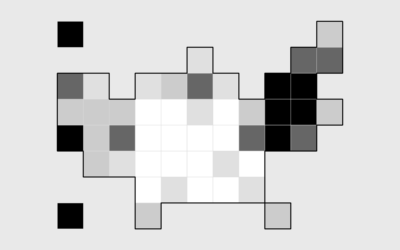
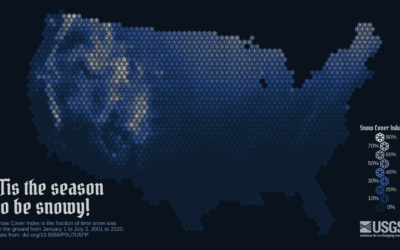
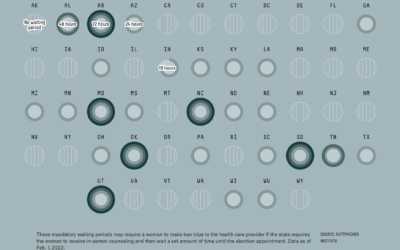
Instead of using geographic boundaries, same-size cells are used to represent areas to provide equal visual attention to all.
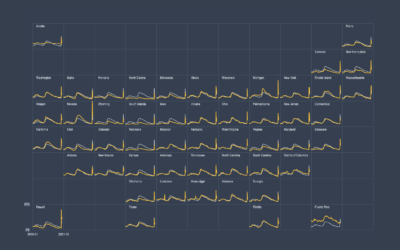
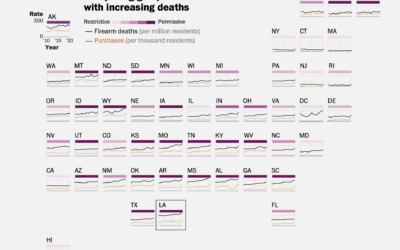
Also known as trellis charts, lattice chart, or whatever you want to call them, the technique lets you compare several categories in one view.
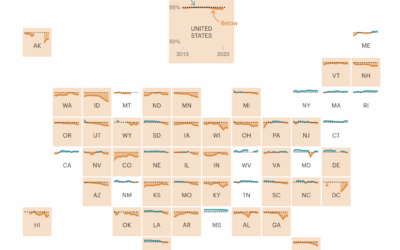
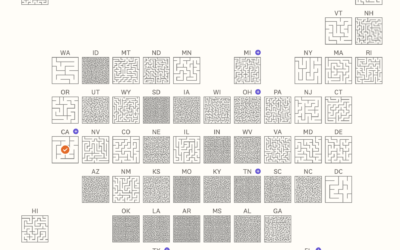
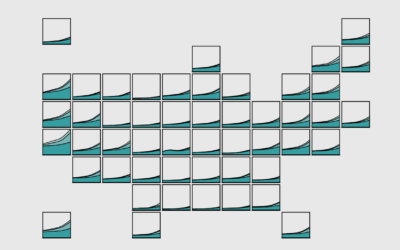
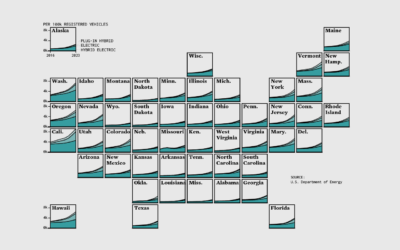
Combining small multiples with the grid layout can make for an intuitive geographic reference.
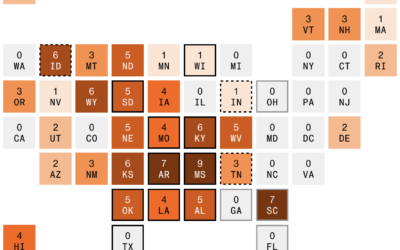
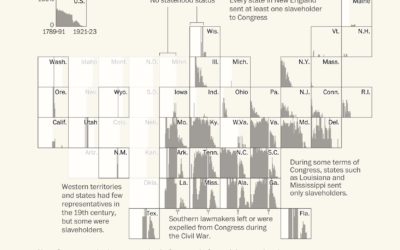
Something of a cross between a reference table and a map, the state grid provides equal space to each state and a semblance of the country to quickly pick out individual states.
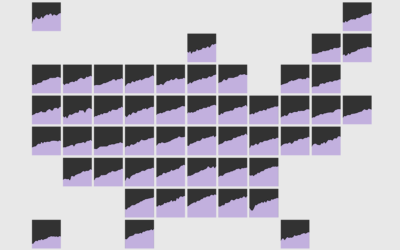
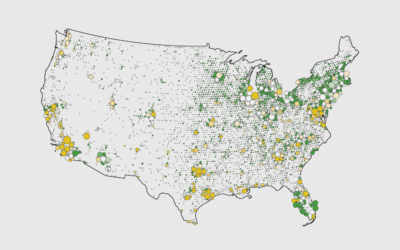
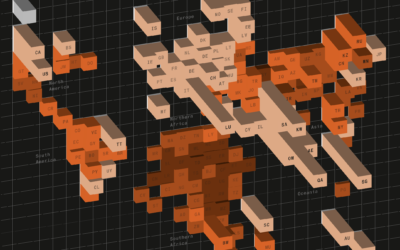
For when your geographic data is evenly spread rather than aggregated by government boundaries.
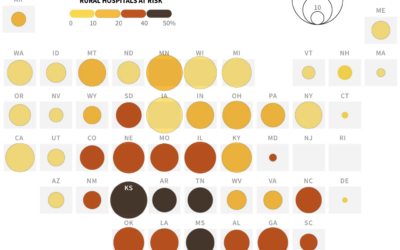
A large portion of rural hospitals operate at a loss, which causes problems…
Vaccination rates are still relatively high, but they need to be for herd…
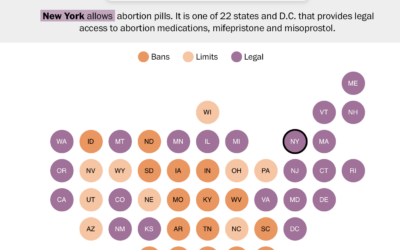
Speaking of grid maps and abortion access, Jan Diehm and Michelle Pera-McGhee, for…
For the Washington Post, N. Kirkpatrick and Szu Yu Chen describe the legality…
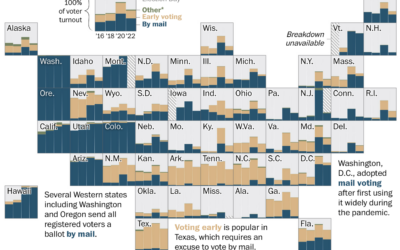
Some states have almost completely moved to voting by mail or early voting,…
About 4% of registered light-duty vehicles in the United States are either electric,…
Breaking it down to the small steps and choices with data, code, and editing that lead to a finished chart.
There are thousands of McDonald's locations, but there are still more golf courses in the United States. This seems surprising, but some maps make it clear.
To show snow cover across the United States, Althea Archer for the USGS…
Davey Alba and Jack Gillum, for Bloomberg, found that Google Maps commonly points…
As I’m sure you know, mass shootings, which gain attention because the scale…
Based on estimates from the World Inequality Lab, Bloomberg shows how wealthier individuals’…
For FiveThirtyEight, Anna Wiederkehr and Amelia Thomson-DeVeaux, with illustrations by Nicole Rifkin, delve…
Using old Census records and documents, Julie Zauzmer Weil, Adrian Blanco and Leo…
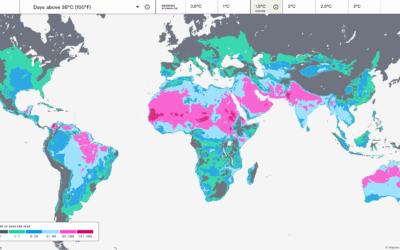
Earth is getting warmer, and the previously abstract concept seems to grow more…
The Bloomberg medal tracker is fun to look at. I think the graphics…