Marc Benioff, the CEO of Salesforce, set out to plant and conserve 1…
Nathan Yau
-
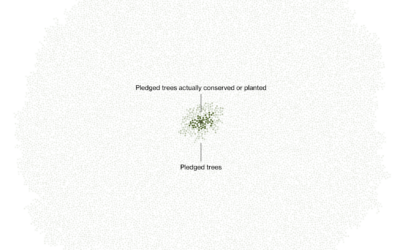
Limited progress towards a plan for planting 1 trillion trees
-
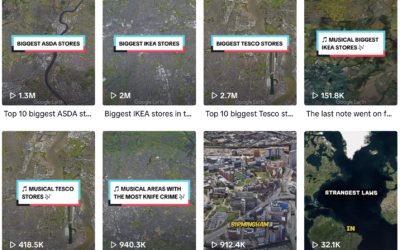
Welcome to the future of data reporting, in musical format
The TikTok account Globetrots combines Google Earth and text-to-speech to show top-ten lists…
-
How Much We Work
In our younger years, we have school and more important things to do, but then we get older and there are bills to pay.
-
Members Only

From Data to Finished Graphics
Knowing what’s next can help you work through a tedious step, because you know it’ll be worth it.
-
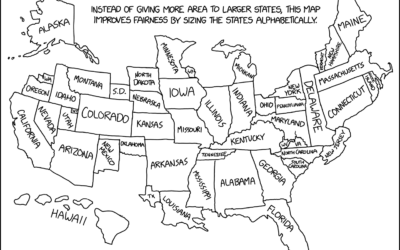
xkcd: Alphabetical cartogram
A deeply insightful map from xkcd.
See also: 19 maps that will blow… -
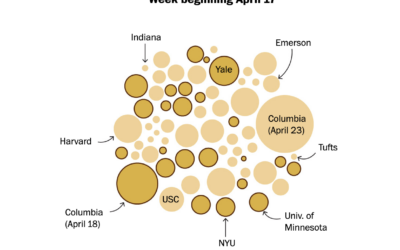
Counts for pro-Palestinian college protests increasing
Based on estimates from the Crowd Counting Consortium, the Washington Post shows the…
-
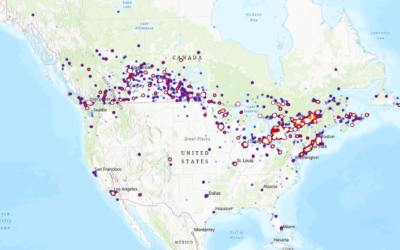
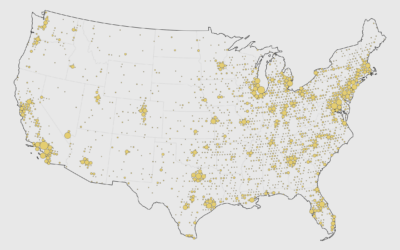
Map of NHL player birth places
Reddit user ChangsManagement mapped where NHL hockey players were born, based on data…
-

The Nature of Code, refreshed
Daniel Shiffman, who you might know from his enthusiastic YouTube channel The Coding…
-
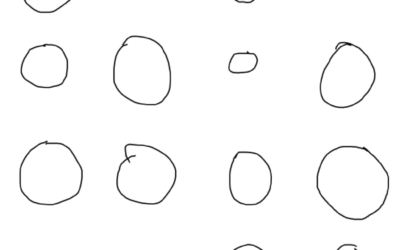
Flipbook drawn by strangers on the internet
The Pudding ran an experiment that asked people to trace a shape. They…
-

Plastics banned in Hong Kong in an effort to reduce waste, scale
Hong Kong banned single-use plastics often used for food takeaway containers. For South…
-
Members Only
Visualization Tools and Learning Resources, April 2024 Roundup
Here are the useful tools and resources that came out of April.
-
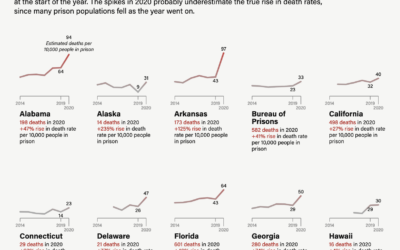
Rise in prison death rates during the pandemic
The Marshall Project highlights research on excess mortality in U.S. prisons:
The slowdown… -
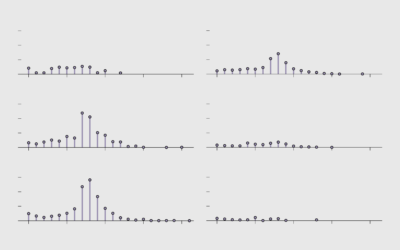
Who is Sleeping, by Age and Time
Sleepy time varies as responsibilities shift.
-
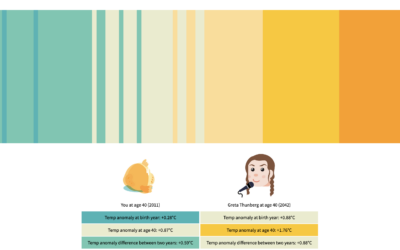
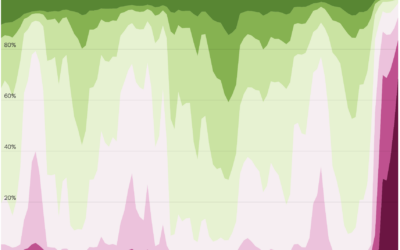
Climate change in your lifetime and the next
One of the challenges of understanding the weight of climate change is that…
-
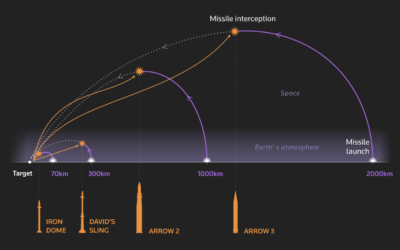
Israel uses Iron Dome as defense against rockets
Using a series of graphics, Reuters explains Israel’s defense against rockets, also known…
-
Existing mortgages with lower rates than new ones
For The Upshot, Emily Badger and Francesca Paris compare the rates of existing…
-
Members Only
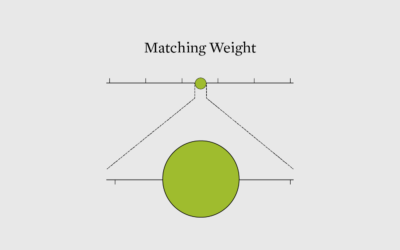
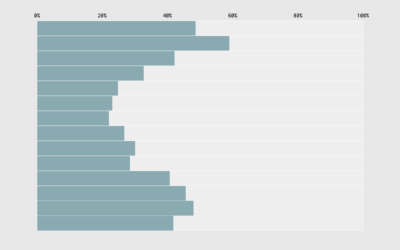
Chart Options When the Differences are Small But Worthwhile
Small changes over time or small differences between categories can easily look insignificant, even if they’re worth noting in real life. Here are chart options for you.
-
Sleep Hours and Feeling Rested
Two-thirds of adults get at least 7 hours of sleep. I am not in that two-thirds.
-
Members Only
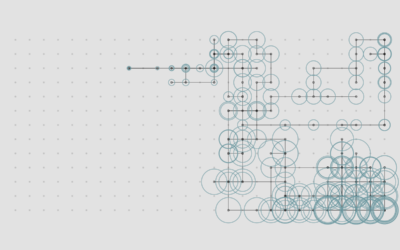
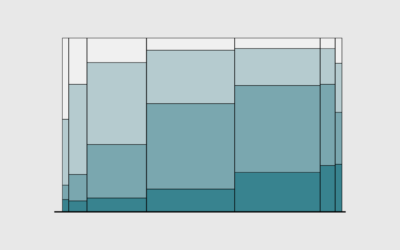
How to Make a Cartogram with Packed Circles in R
There are packages to make cartograms, but in some cases you might need a more flexible solution.
-
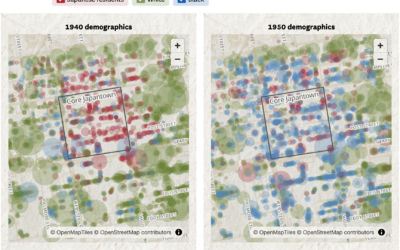
What happened to Japantown in San Francisco when residents were forced out by executive order
In 1942, Franklin Delano Roosevelt mandated that those of Japanese descent be sent…
Recently for Members
Second Edition
 Visualize This: The FlowingData Guide to Design, Visualization, and Statistics (2nd Edition)
 Visualize This: The FlowingData Guide to Design, Visualization, and Statistics (2nd Edition)
New tools, refined process.
Browse by Chart Type See All →


