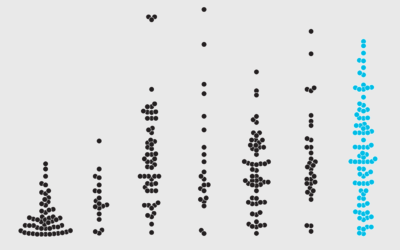
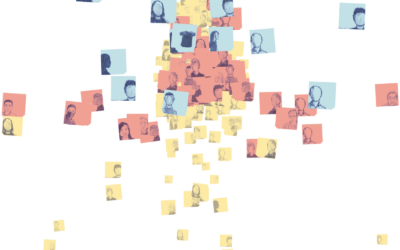
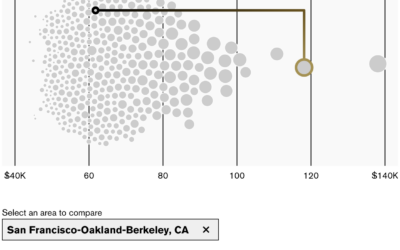
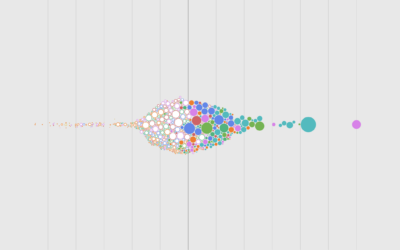
It emphasizes individual points in a distribution instead of binning them like a histogram.
I refreshed an old project with new data and interactions. This week we walk through the steps.
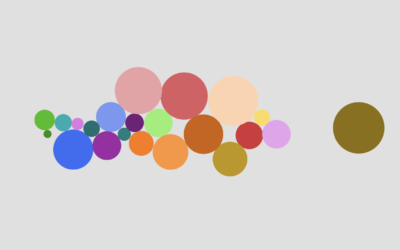
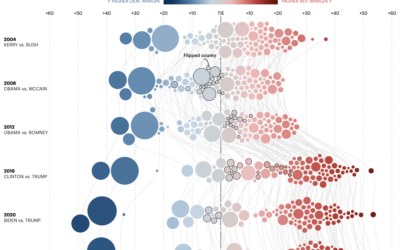
Beeswarm charts are useful to highlight individual categories or entities. Animating them can help highlight change over time.
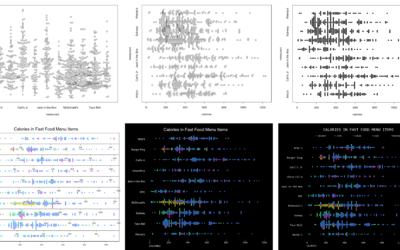
Defaults are generalized settings to work with many datasets. This is fine for analysis, but data graphics for presentation benefit from context-specific design.
The histogram is my favorite chart type, but it's unintuitive for many. So I've been using the less accurate but less abstract beeswarm.
Try the more element-based approach instead of your traditional histogram or boxplot.
Millions of people protested in Hong Kong against China’s Communist Party back in…
The challenges continue for women who want clothes that fit properly. For the…
Congress released a cache of Jeffrey Epstein’s email threads. For the Wall Street…
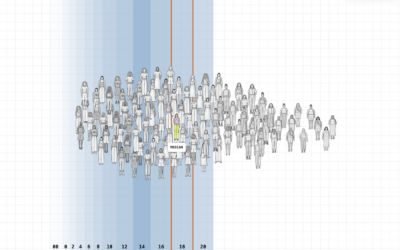
Salaries vary by occupation. These charts show the spread.
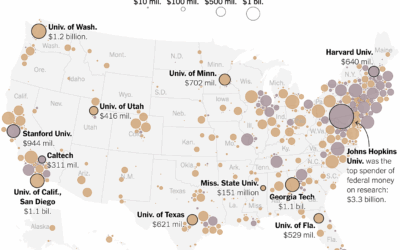
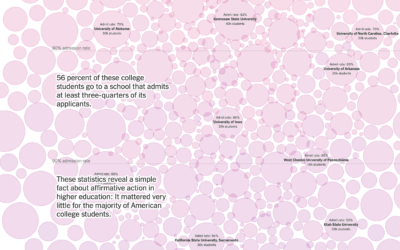
Big universities more often make the news, but the freeze in federal funding…
New to me, Bloomberg has an interactive by Claire Ballentine and Charlie Wells…
For the Minnesota Star Tribune, Yuqing Liu and C.J. Sinner show how the…
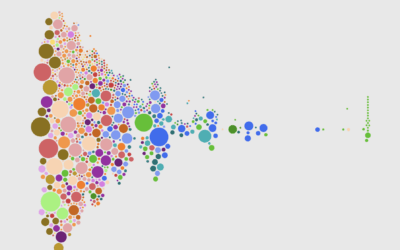
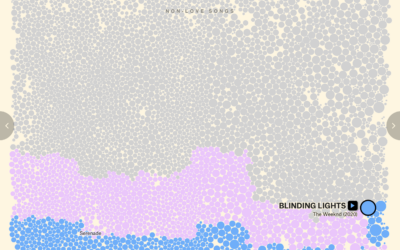
For The Pudding, David Mora and Michelle Jia examine the death of the…
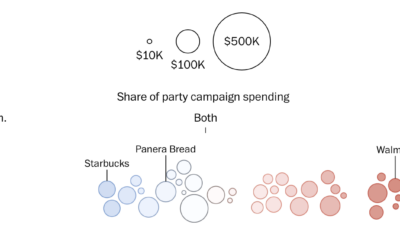
For WP’s Department of Data, Kati Perry and Adrián Blanco examine campaign spending…
Asian workers are more than three times more likely to be physicians. What other jobs jump out? What's it like for other races and ethnicity?
For NYT Opinion, Richard Arum and Mitchell L. Stevens, with graphics by Quoctrung…
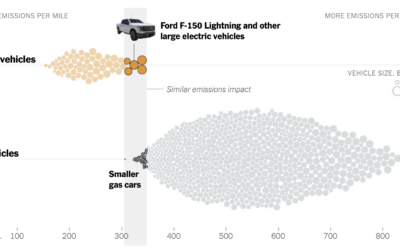
Based on estimates from CarbonCounter by the MIT Trancik Lab, electric vehicles typically…
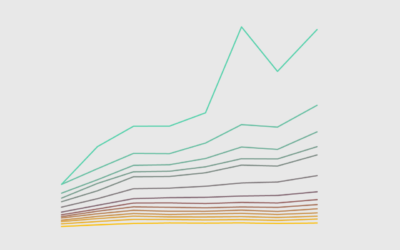
The rich continue to get richer, and everyone else either only kind of earns more or stays where they're at.
Animals are going extinct at a faster rate. Reuters shows a developing pattern…
With Chartball, Andrew Garcia Phillips has visualized sports data for a while, publishing…
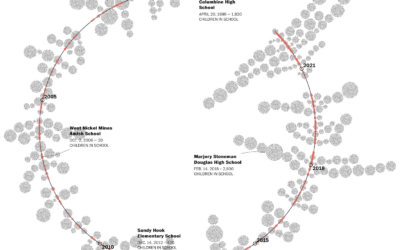
The Washington Post maintains a database of school shootings (which is sad in…