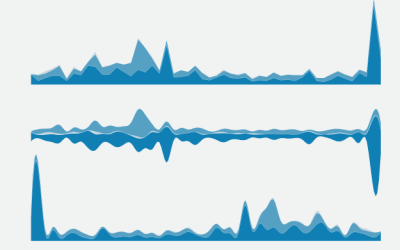
It’s like a stacked area chart but with a zero-offset to optimize centrality.
The discussions this week felt familiar. Probably because we've seen this many times, since the beginning of charts themselves.
Animated transitioning between chart types can add depth to your data display. Find out how to achieve this effect using JavaScript and D3.js.
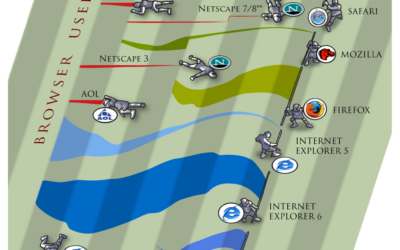
From the basic area chart, to the stacked version, to the streamgraph, the geometry is similar. Once you know how to do one, you can do them all.
The Trans News Initiative is a collaborative effort to track news coverage of…
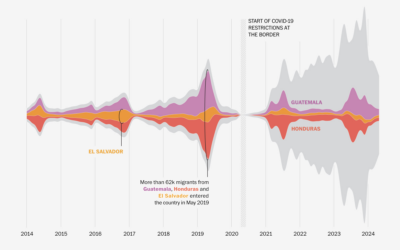
A lot of immigration talk in the U.S. focuses on Mexico, but immigrants…
I hear it all the time from chart purists. “I love the streamgraph!”…
The Bloomberg medal tracker is fun to look at. I think the graphics…
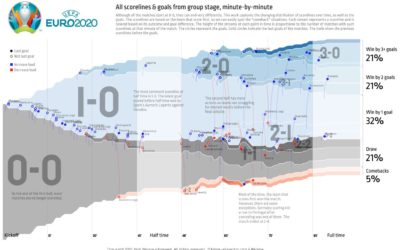
To see all the matches from the group stage of Euro 2020 in…
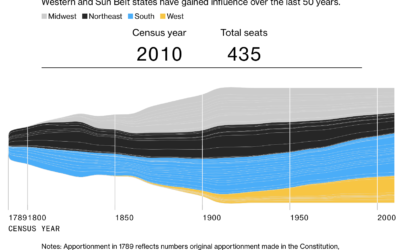
The 2020 Census count at the state level is set for release this…
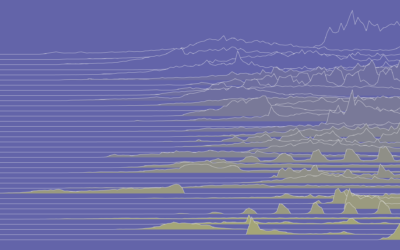
As of September 2018, there were 892 million comments for the year so far, spread out over 355,939 subreddits. Here's how it got to this point, and "what the internet has been talking about" during the past 12 years.
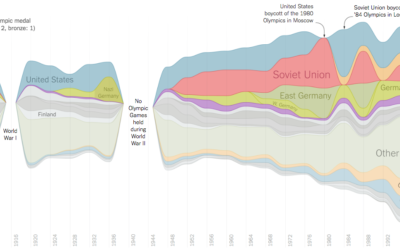
Gregor Aisch and Larry Buchanan for the New York Times visualized Olympic medal…
Moving on from the most trendy names in US history, let’s look at…
Because it’s Friday – PixelLabs puts a cartoon-ish spin on streamgraphs. Who will…
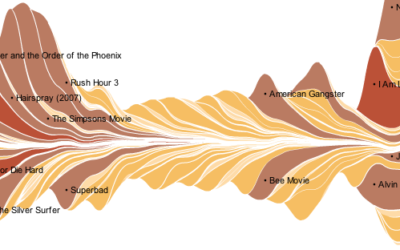
The New York Times puts out another good one in this graphic for the talkies.