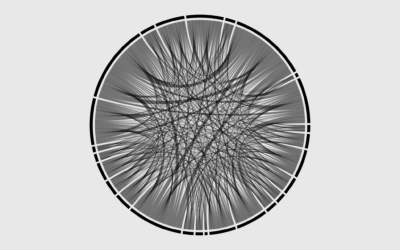
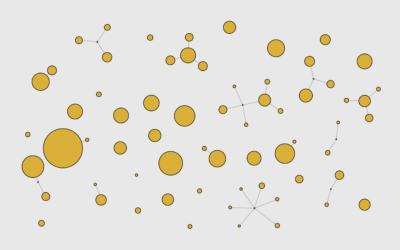
Nodes and edges show connections, typically positioned to show strength of relationships.
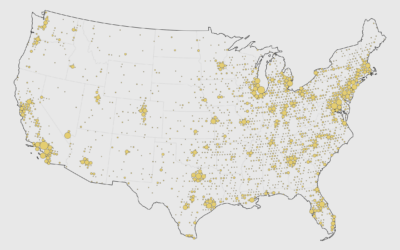
There are packages to make cartograms, but in some cases you might need a more flexible solution.
Process the data into a usable format, which makes the visualization part more straightforward.
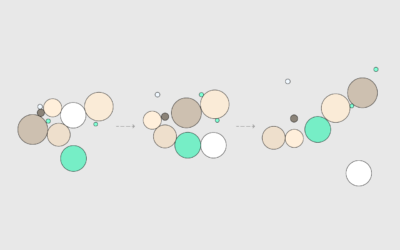
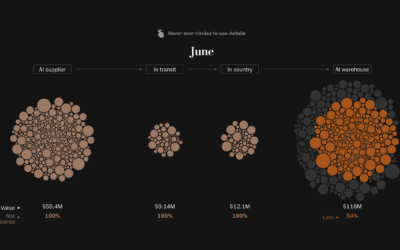
Pack circles, figure out the transitions between time segments, and then generate frames to string together.
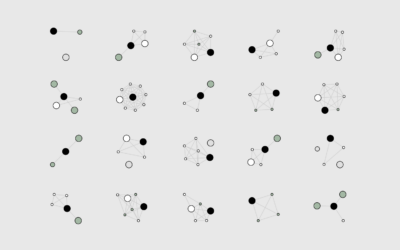
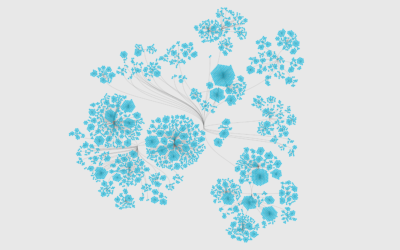
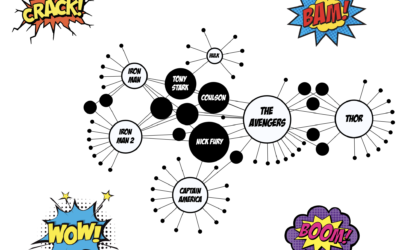
Network graphs are a good way to find structure and relationships within hierarchical data. Here are several ways to do it.
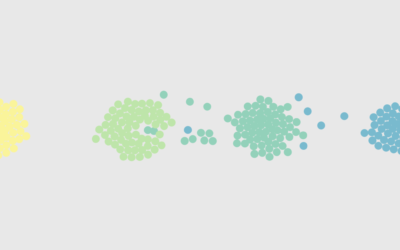
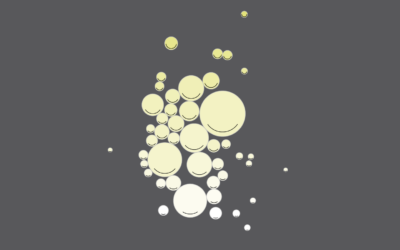
Ooo, bubbles... It's not the most visually efficient method, but it's one of the more visually satisfying ones.
Show connections in the circular layout for a more compact presentation.
For the Wall Street Journal, David Uberti, Juanje Gómez, and Kara Dapena mapped…
Earlier this year, the administration halted USAID shipments of antimalarial and HIV medical…
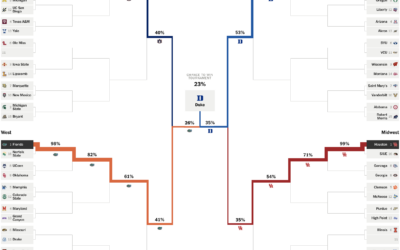
Leading up to the NCAA Men’s basketball tournament, the Athletic has a bracket…
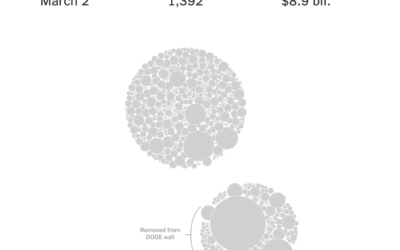
The “Department of Government Efficiency” keeps a “Wall of Receipts” to signal transparency…
Here's the current landscape of supermarket parent companies and their subsidiaries — national chains, regional, local, co-ops, specialty, ethnic, and discount.
For the Minnesota Star Tribune, Yuqing Liu and C.J. Sinner show how the…
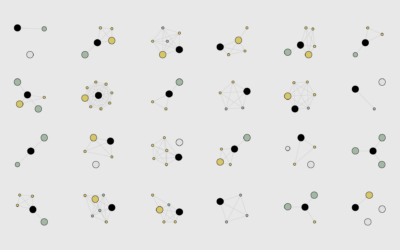
No need to restrict ourselves to the most common types. There are thousands. Let's look at all of them.
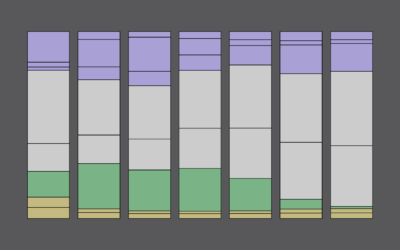
What people are doing when they are happy and not, from age 20 to 70.
Agar.io is a multiplayer game where people control cells in a Petri dish-type…
With Chartball, Andrew Garcia Phillips has visualized sports data for a while, publishing…
With a fun view of the Marvel Cinematic Universe, Tristan Guillevin walks through…
You’ve probably seen the moving bubbles that show how something changes over time.…
Oftentimes what we're doing isn't so important as who we're spending our time with.
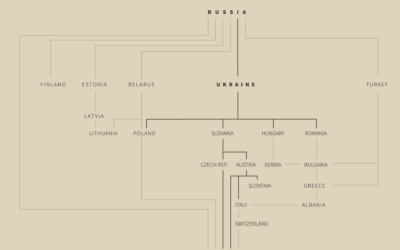
For Reuters, Prasanta Kumar Dutta, Samuel Granados and Michael Ovaska detail Europe’s dependence…
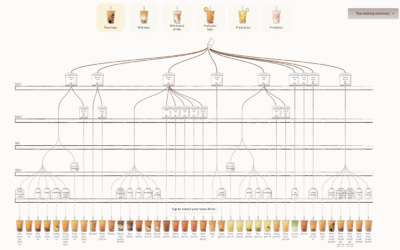
Walk into a boba shop and usually you’ll see a large menu that…
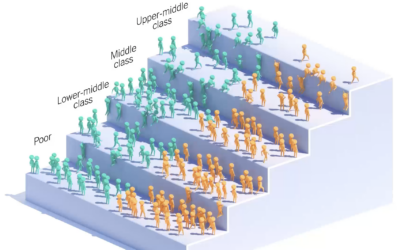
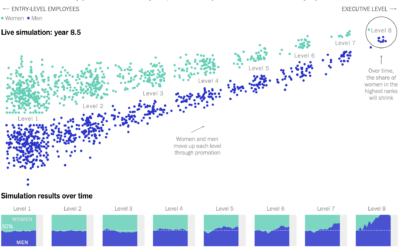
Yuhao Du, Jessica Nordell, and Kenneth Joseph used simulations to study the effects…