Frequency Trails

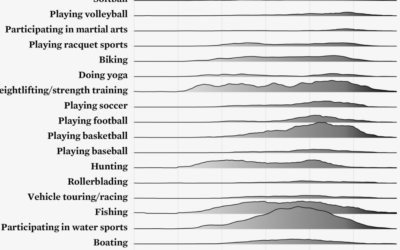
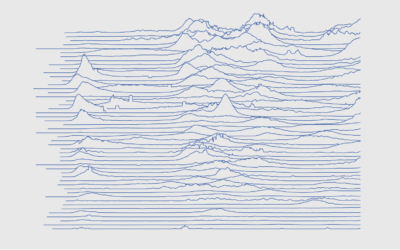
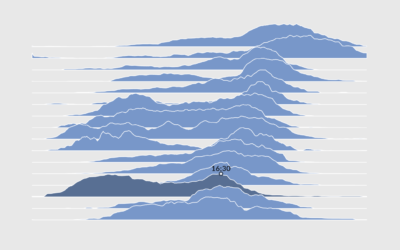
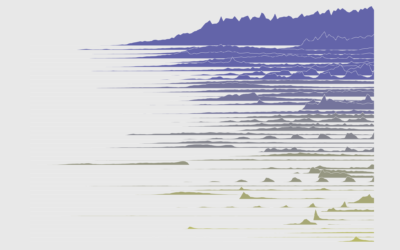
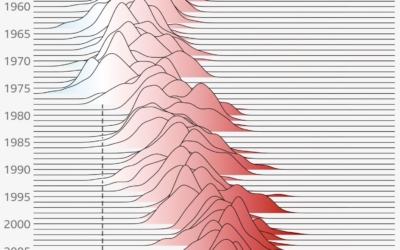
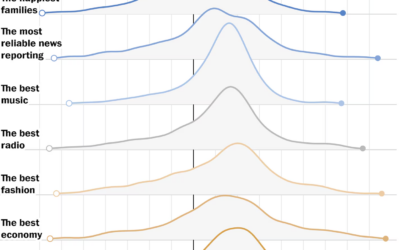
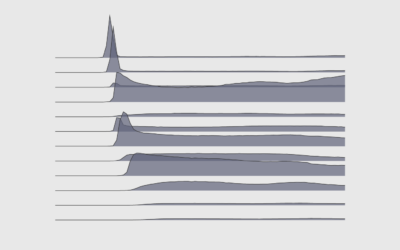
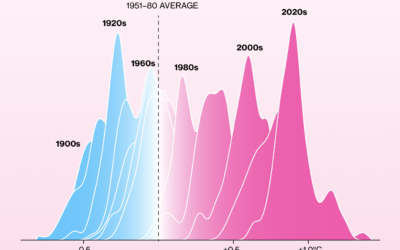
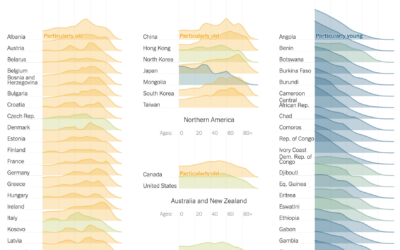
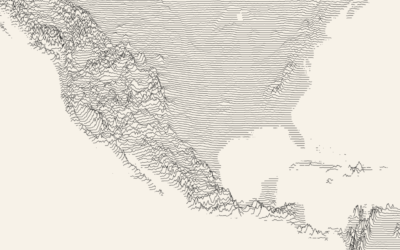
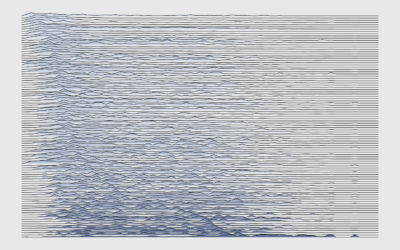
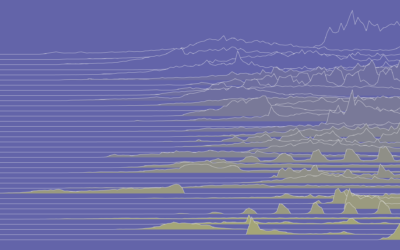
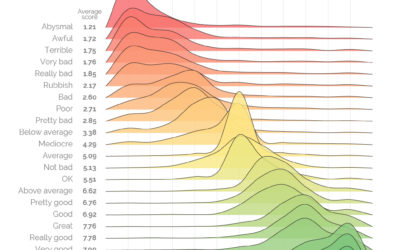
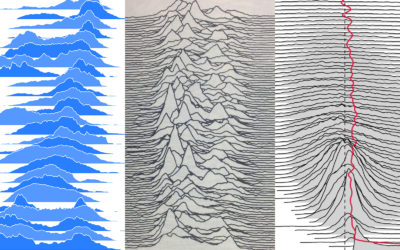
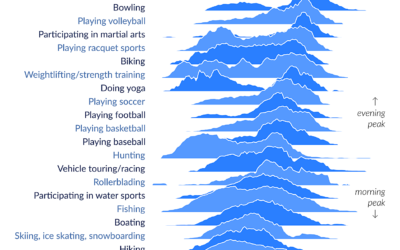
Area or line chart value axes overlap to fit more in a space and add another visual aspect to the magnitude of peaks. Also known as: ridgeline chart, joyplot.

Tutorials and Guides

Examples

Highest Education Level and Age Distributions

Education paths start to diverge towards the end of high school and after.

Shifting towards more hot days, fewer cold days

It keeps getting hotter around the world. Not every single day. But over…

Age shifts around the world

The world is getting older overall. For The New York Times, Lauren Leatherby…

Trendiest Baby Name Every Year Since 1930, in the U.S.

Baby names gain sudden popularity for various reasons. See how it's changed over the years.

Frequency trails in the snow

Same vibes pic.twitter.com/oXjhdwS3yW — Matt Blackwell (@matt_blackwell) February 7, 2022 This is a…

Daily Routine, 2020

After looking at how much time we spent on daily activities in 2020, let's look at when we spent our time.

Draw a ridgeline map showing elevation, for anywhere on Earth

Ridgeline charts or frequency trails use parallel lines that overlap on the fluctuations,…

When People Find a New Job

Looking at the 100 most common jobs people switched to, a timeline comes into view when we adjust the relative switch rates by age.

Growth of Subreddits

As of September 2018, there were 892 million comments for the year so far, spread out over 355,939 subreddits. Here's how it got to this point, and "what the internet has been talking about" during the past 12 years.

Measuring the varied sentiments of good and bad words

There was a survey a while back that asked people to provide a…

Frequency trails chart explainer

Frequency trails, or currently better known as joyplots, is a visualization method to…

Peak times for leisure and sports

The American Time Use Survey asks people what they do during the day.…