This week, we talk limitations of the defaultiest of defaultiest chart types.
variation
-
Members Only
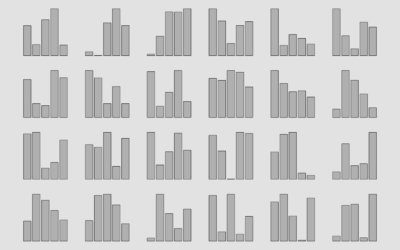
Weakness of a bar chart
-
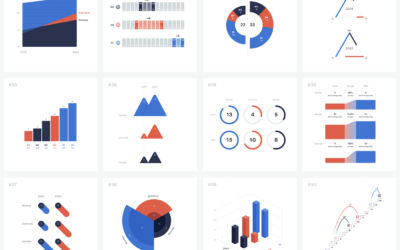
100 visualizations from a single dataset with 6 data points
The structure of a dataset can help you pick a visualization method or…
-
Members Only

Seeing Ranges – The Process 152
You’re gonna miss out on all the good stuff if you just stare at the middle.
-
Members Only
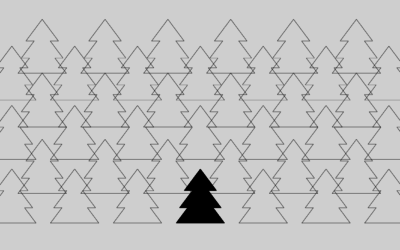
Missing the Trees for the Forest (The Process #43)
Don’t step so far away from the data that you miss the details that provide meaning to the overviews.
-
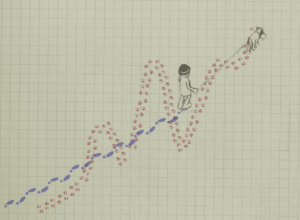
Difference between weather and climate explained
The difference:
In this animated short, the relationship between trend and variation are…
Recently for Members
Second Edition
 Visualize This: The FlowingData Guide to Design, Visualization, and Statistics (2nd Edition)
 Visualize This: The FlowingData Guide to Design, Visualization, and Statistics (2nd Edition)
New tools, refined process.
Browse by Chart Type See All →


