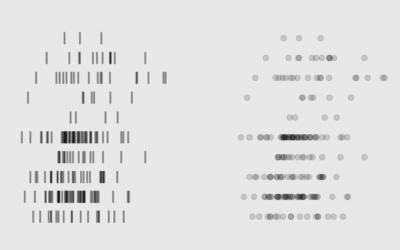
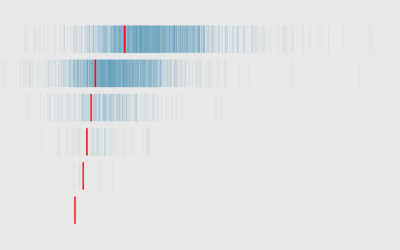
Dots are placed along a single continuous scale to show distribution along the corresponding variable.
For when you want to show or compare several distributions but don't have a lot of space.
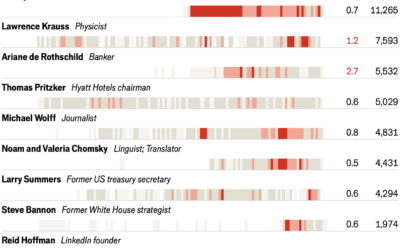
With the most recent Epstein release, the Economist collaborated with the folks who…
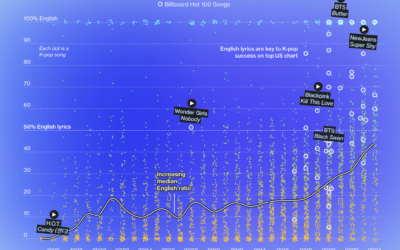
K-pop grew mainstream-popular in countries outside South Korea over the past few years.…
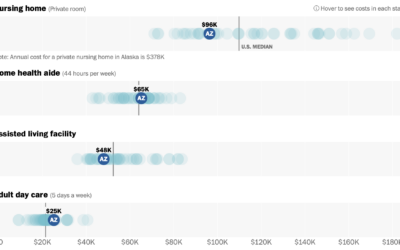
Assisted living can be expensive. For The Washington Post, Bonnie Berkowitz, Lauren Tierney,…
Here's household income by number of earners in the household, based on data from the 2022 Current Population Survey.
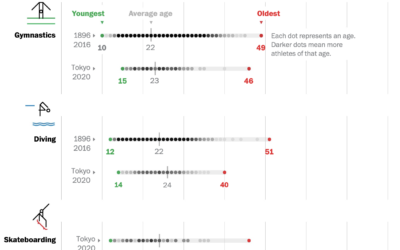
Bonnie Berkowitz and Artur Galocha go with the strip plot to show the…
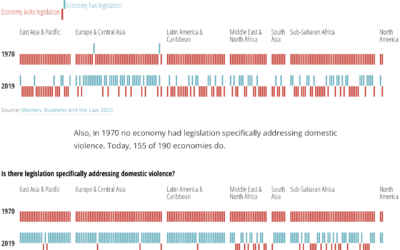
The World Bank tracks global development through a number of indicators. (You can…