Visualization online can be a challenge if you don’t know how to program.…
-
Vega: A visualization grammar to create without programming
-
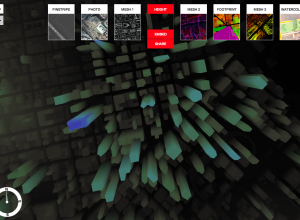
An experimental map service using 3-D data
For the past few months, Stamen Design has been working with 3-D data…
-

A Survival Guide to Starting and Finishing a PhD
Tips on making it through, what I would tell my previous self going in, and advice on taking advantage of the unique opportunity that is graduate school.
-
Link
Magic Grants from Brown Institute for Media Innovation
The Brown Institute for Media Innovation has a call for magic grants for “a small team of graduate students or postgraduates who are expected to demonstrate the relevance and viability of their ideas by implementing a prototype or creating an innovative media product.” The Columbia branch is led by my adviser. Proposal submission deadline is May 3.
-
Link
Jeffrey Hammerbacher, Chief Scientist at Cloudera
Jeffrey Hammerbacher, Chief Scientist at Cloudera talks about big data in Charlie Rose interview.
-
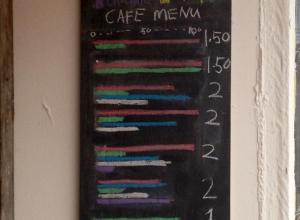
Chartspotting: Coffee graph menu
FlowingData reader Amir sent this along. In lieu of a list of coffee…
-
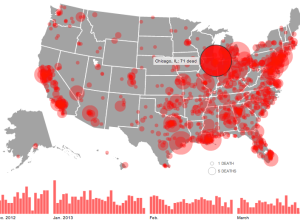
Gun deaths since Sandy Hook
The shooting at Sandy Hook Elementary School was horrible, but there have been…
-
Metrico, an infographic puzzle game
Metrico is a puzzle action game for PlayStation Vita that centers around charts…
-
Link
Yelp Dataset Challenge
Yelp is putting up over 200,000 reviews and offering ten $5,000 awards for students who want to make use of their data.
-
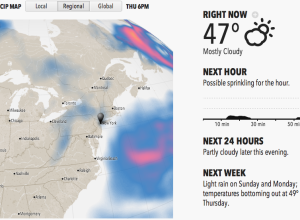
Forecast: A weather site that’s easier to read
When you go to one of the major sites to look up the…
-
Link
Data Scientist opening at NYT
There’s a data scientist opening at The New York Times, probably to fill the gap left by DataKind founder Jake Porway. [via]
-
How to become a password cracker in a day
Deputy editor at Ars Technica Nate Anderson was curious if he could learn…
-
Link
Watching Drones Drop
Pitch Interactive’s drone visualization spread across the Web yesterday. Wes Grubbs, the founder of the group, talked about the data on HuffPost Live.
-
Link
NLTK Book
The Natural Language Toolkit is a Python library that is commonly used to extract data from text. There’s a free, online-accessible book to learn how to use it.
-
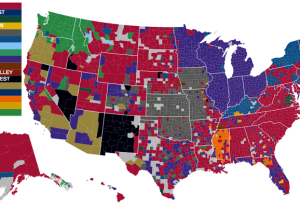
March Madness fan map
Along the same lines as their NFL fan maps, Facebook had a closer…
-
Link
Ph.D. students rethink the tenure track
Ph.D. students rethink the tenure track. The traditional approach is to get your degree and then look for a professor job. That’s changing though, and more people leave academia after they graduate. I think when I first got into graduate school academia was top on my list, too, but after working with my adviser and other professors, it didn’t seem like a job I’d enjoy.
-
Link
Spatial Memory: Mapping Blank Spots in the Cheeseboard Maze
Mapping Blank Spots in the Cheeseboard Maze. “IST Austria Professor Jozsef Csicsvari together with collaborators has succeeded in uncovering processes in which the formation of spatial memory is manifested in a map representation.”
-
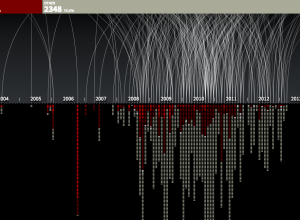
Every known drone attack in Pakistan
It’s hard to know the impact of drone attacks as outsiders looking in,…
-

Data Points: What it’s like to write a book
As the publication of Data Points nears, I’m excited to hold it in…
-
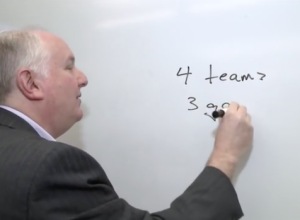
Odds of a perfect NCAA March Madness bracket
Math professor Jeff Bergen explains the odds of picking a perfect bracket.…
Recently for Members
Second Edition
 Visualize This: The FlowingData Guide to Design, Visualization, and Statistics (2nd Edition)
 Visualize This: The FlowingData Guide to Design, Visualization, and Statistics (2nd Edition)
New tools, refined process.
Browse by Chart Type See All →


