A Guide to Speeding Up R Code for Busy People. R can be slow at times. Here are some tips on getting it to go faster.
-
Link
A Guide to Speeding Up R Code for Busy People
-
Data Points: Sample chapter
It’s hard to believe it’s been over a month since Data Points: Visualization…
-
Cicada insects out to play after 17 years
This is my first time hearing about this, probably because it only happens…
-
Link
Geoguessr
GeoGuessr is a game of location. It plops you somewhere in the world via Google street view, and you figure out where you ara. The closer you are, the more points you get.
-
Link
Creating a hexagonal cartogram
How to create a hexagonal cartogram using a combination of ArcGIS, Python, and D3.
-
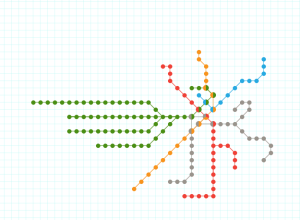
Exploration of how much geography is needed in metro maps
Terrence Fradet of Fathom Information Design ponders whether metro maps suffer or benefit…
-
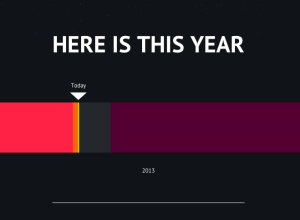
Putting today into perspective
When you focus on all the small events and decisions that happen throughout…
-
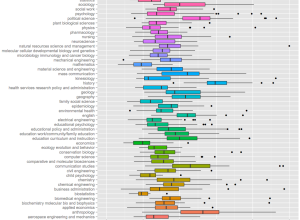
Length of the average dissertation
On R is My Friend, as a way to procrastinate on his own…
-
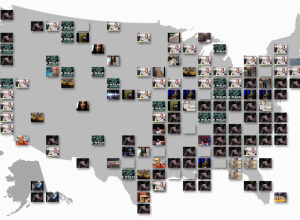
YouTube Trends map shows most popular videos by region
I don’t know about you, but when I go to YouTube, I check…
-
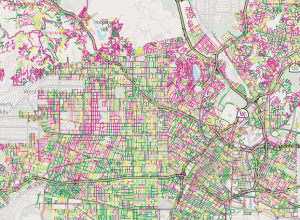
Map shows street quality in Los Angeles →
Nevermind the horrible traffic in Los Angeles, where it takes a several hours…
-

Color signatures for classic novels
Jaz Parkinson made color signatures for classic novels. Basically, mentions of colors were…
-
Link
Path Social Networking App Settles FTC Charges
Path, a social networking app that lets you track and share personal information about yourself, settled with the FTC for $800k. They allegedly collected kids’ personal information without their parents’ consent. This is from February but important to know.
-
Link
Data Crunchers Now the Cool Kids on Campus
Data Crunchers Now the Cool Kids on Campus. Well, about as cool as someone who calls his or herself a data cruncher, anyways.
-
Link
Geographic Bounding Boxes
Geographic Bounding Boxes. A trivial task in a 2-D space, but tricker on sphere.
-

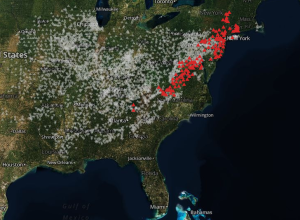
Glowing landscape shows river history
The poster by Daniel E. Coe shows the life-like historical flows of the…
-
Fixing bus routes using mobile data
In parts of the world where there are few smartphones and GPS-enabled devices,…
-
Link
I’m still here: back online after a year without the internet
Paul Miller disconnected from the Internet completely for a year. He describes an experience of at first feeling free and unburdened but eventually feeling lonely and, well, disconnected.
-
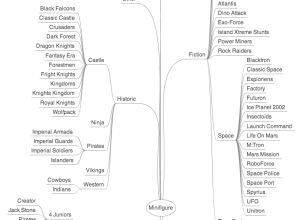
Lego minifigure taxonomy
There are over 4,000 Lego minifigure characters ranging from plumbers and judges to…
-
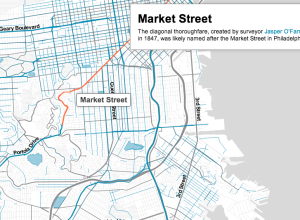
History of San Francisco street names mapped
Where do street names come from? Sometimes there’s actual history behind a name,…
-
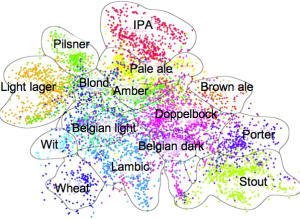
Beer Mapper: An experimental app to find the right beer for you
Kevin Jamieson, an electrical and computer engineering graduate student at the University of…
Recently for Members
Second Edition
 Visualize This: The FlowingData Guide to Design, Visualization, and Statistics (2nd Edition)
 Visualize This: The FlowingData Guide to Design, Visualization, and Statistics (2nd Edition)
New tools, refined process.
Browse by Chart Type See All →


