This is how marketers see visualization and information graphics. Glorified spam, kind of.
-
Link
Why infographics rule →
-
Five years of traffic fatalities
I made a graphic a while back that showed traffic fatalities over a…
-
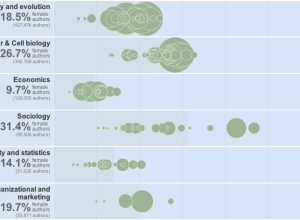
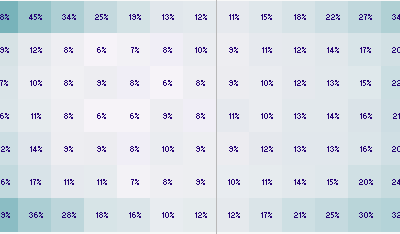
Women as academic authors over the years →
The Chronicle of Higher Education has a look at the percentage of academic…
-
Link
D3 map projections →
A collection by Jason Davies of the map projections possible with D3
-
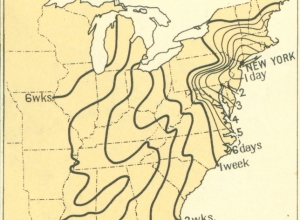
Time of travel in the 1800s
From the 1932 Atlas of the Historical Geography of the United States, these…
-
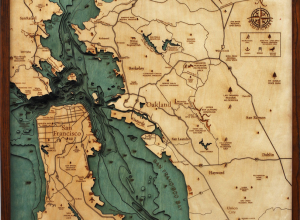
Wood charts reveal layers of underwater world →
Below the Boat produces beautiful laser-cut wood maps:
Starting with a bathymetric chart… -
Link
R and Data Mining: Examples and Case Studies →
Download the book as a PDF with R code supplement
-
Link
Eyeo Festival 2013 →
Tickets don’t go on sale until February, but the first half of the speaker list was revealed. Looks great.
-
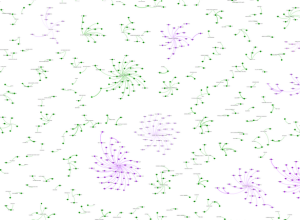
Wine industry network in the US
A group of researchers at Michigan State University, led by Phil Howard, explored…
Recently for Members
Second Edition
 Visualize This: The FlowingData Guide to Design, Visualization, and Statistics (2nd Edition)
 Visualize This: The FlowingData Guide to Design, Visualization, and Statistics (2nd Edition)
New tools, refined process.
Browse by Chart Type See All →


