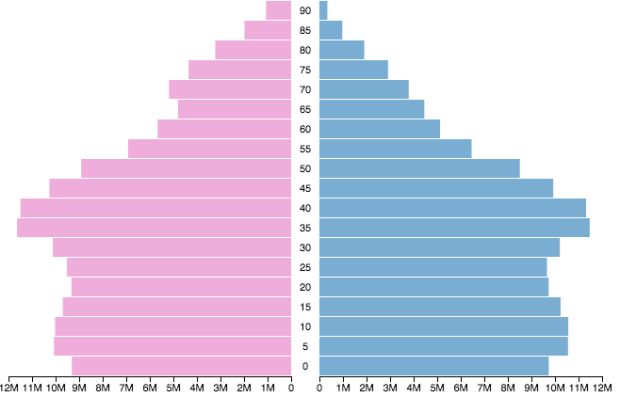
Visualization online can be a challenge if you don’t know how to program. Analytics startup Trifacta just lightened the load with Vega, a “visualization grammar” that lets you create and share by editing a JSON file. Check out the demo live editor to see how this works. Select different chart types from the drop down menu on the top left, which you can render in HTML5 Canvas or SVG.
Of note: Vega is built on top of Data-Driven Documents.
To get right to the point: Vega is NOT intended as a “replacement” for D3. D3 is intentionally a low-level system. During the early design of D3, we even referred to it as a “visualization kernel” rather than a “toolkit” or “framework”. In addition to custom design, D3 is intended as a supporting layer for higher-level visualization tools. Vega is one such tool, and leverages D3 heavily within its implementation.
Gonna keep an eye on this one.


 Visualize This: The FlowingData Guide to Design, Visualization, and Statistics (2nd Edition)
