Alex Reinhart, a PhD statistics student at Carnegie Mellon University, covers some of…
-
Statistics Done Wrong, a guide to common analysis mistakes
-
Weightless Project uses personal tracker data to abate hunger and obesity
The Weightless Project gives you another reason to use your Jawbone or Fitbit…
-

Happy holidays
Checking out for the year. I assume most of you have already, and…
-
FlowingData Job Board, December 2013
Looking to get a jumpstart on that new year’s resolution to find a…
-
Iron Maiden uses piracy data for tour locations
When you hear “piracy data” and “music” in the same sentence, it usually…
-
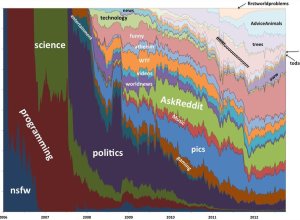
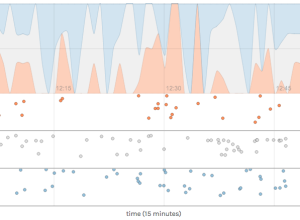
Evolution of reddit in stacked areas
Computer science PhD student Randy Olson likes to analyze reddit in his spare…
-
Highway traffic reorganized by color
In the video above, filmmaker Cy Kuckenbaker reorganized midday traffic by color. No…
-
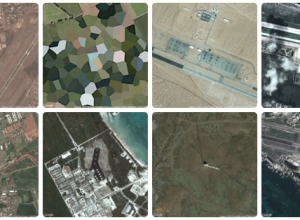
Military footprint
Similar to his collection of prison map snapshots, Josh Begley collected images of…
-
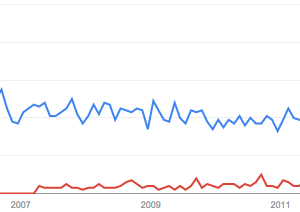
Data scientist surpasses statistician on Google Trends
The relative interest in data scientist surpassed statistician this month. It was also…
-
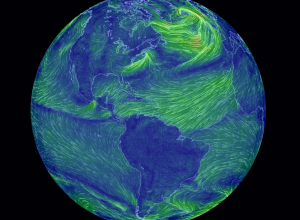
Earth wind map
Remember the wind map of the United States by Martin Wattenberg and Fernanda…
-
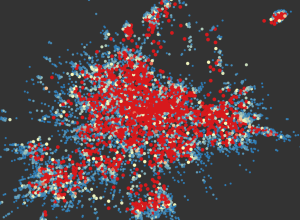
Network of subreddits
There are over 5,000 subreddits with plenty of overlap and similarities. Randy Olson…
-
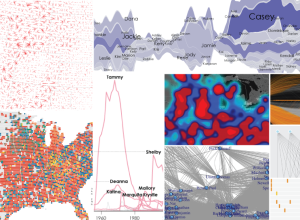
Data and visualization year in review, 2013
Visualization continues to mature and focus more on the data it represents than on novel designs and size. Let’s have a look back.
-

Airport billboard encourages wonderment
Airports conjure thoughts of security, bag checks, and cramped spaces, and flights are…
-
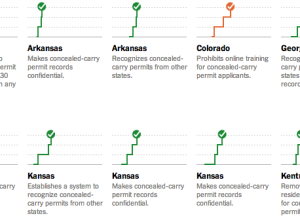
State gun laws since Newtown →
The New York Times explored state gun bills since Newtown.
In the 12… -
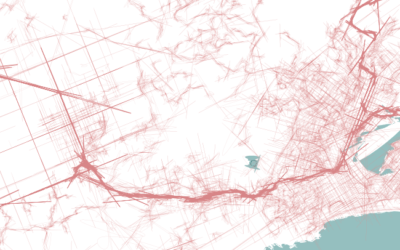
Uncertain cartographies
Most people know the layout of their neighborhoods and some are good with…
-
Easy text classification
Text can be a great source of data, but it can be a…
-
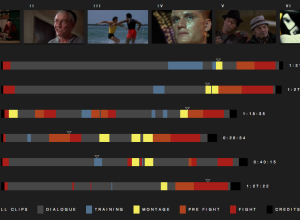
Rocky movie breakdown
Fathom Information Design watched all six Rocky movies, classified segments into dialogue, training,…
-
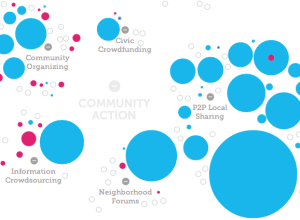
Growth in civic tech
Fathom Information Design, in collaboration with the Knight Foundation and Quid, visualized the…
-
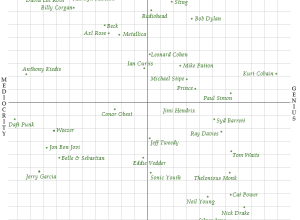
Artist temperaments
Just for kicks, Jimmy Chen plotted artists on a subjective arrogance-vs-genius scale. Above…
-
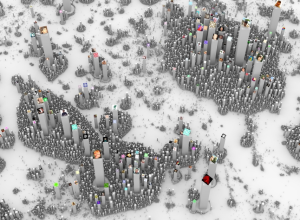
Online habitats
Ekisto, by visual artist Alex Dragulescu, is an experiment in visualizing online communities…
Recently for Members
Second Edition
 Visualize This: The FlowingData Guide to Design, Visualization, and Statistics (2nd Edition)
 Visualize This: The FlowingData Guide to Design, Visualization, and Statistics (2nd Edition)
New tools, refined process.
Browse by Chart Type See All →


