It was World AIDS Day last week and UNAIDS published the latest estimates…
-
The Geography of AIDS Around the World
-
Problem Comparison: Tiger Woods vs. Jay-Z
This, by Mike Arauz, is just too funny not to post. Sorry, Tiger.…
-
Comment to win free copies of The Visual Miscellaneum: Winners announced!
As we all know, David McCandless of Information is Beautiful, launched his new…
-
Should You Get the H1N1 Vaccine?
David McCandless, author of The Visual MIscellaneum, delves into the usefulness of the…
-
Stat Charts Get a New York Times Redesign
Statistical graphics are often… kind of bland. But that’s fine, because they’re usually…
-
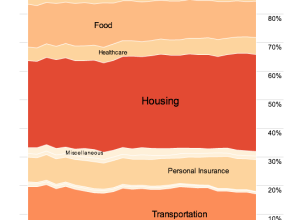
Past 25 Years of Consumer Spending
How has consumer spending changed over the past 25 years? Do we spend…
-
Best of FlowingData: November 2009
November was another good month. We passed the 25k-subscriber mark for the first…
-
A New Way to Search Images With Google Image Swirl
There’s this branch in computer science and statistics for vision research. Normally, if…
-
Can You Guess What These Maps Show?
I’m no doubt still under massive food coma at this time, but in…
-
Black Friday Starts Now. 3 Prints for 1!
Straight to the point. It’s Black Friday. Here’s the deal. Get 1 print…
-
What’s Cooking on Thanksgiving, Mapped and Ranked
Food-wise, Thanksgiving is different across the country. In some places you’re going to…
-

Fox News Makes the Best Pie Chart. Ever.
What? I don’t see anything wrong with it.…
-
9 Ways to Visualize Proportions – A Guide
With all the visualization options out there, it can be hard to figure…
-
Battle of the Coverage Maps: Verizon vs. AT&T
Verizon has been running these ads lately that compare their 3G coverage to…
-
The Cost of Getting Sick
GE and Ben Fry (now the director of SEED visualization), show the cost…
-
Buzzwords in Academic Papers (Comic)
This comic was really amusing, although it might be because I’m a big…
-
Thank You, FlowingData Sponsors
Thank you to the FlowingData sponsors for keeping the servers alive. Without them,…
-
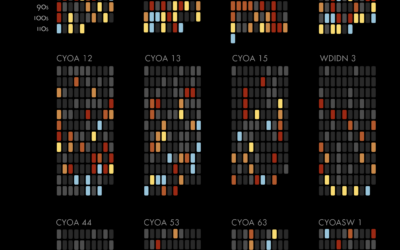
Choose Your Own Adventure – Watch the Stories Unfold
Interaction designer Christian Swinehart takes a careful look at the popular Choose Your…
-
The Future: Embedding Data in the Everyday
Imagine a world where data becomes the everyday, simply embedded in what you…
-
Visualize This: Class Size and Quality of Education. Your Turn
Photo by Night Owl City
Last week I posted some parallel coordinate plots…
Recently for Members
Second Edition
 Visualize This: The FlowingData Guide to Design, Visualization, and Statistics (2nd Edition)
 Visualize This: The FlowingData Guide to Design, Visualization, and Statistics (2nd Edition)
New tools, refined process.
Browse by Chart Type See All →


