A BIG thank you to our sponsors. You keep FlowingData running smoothly, make…
-
Thank You FlowingData Sponsors
-
Target Store Openings Since the First in 1962 – Data Now Available
FlowingData readers who have been around for a while will remember I made…
-

Open Thread: What the **** is Visualization Anyways?
I think ever since visualization got started, people have been asking this question.…
-

How Much Do CEOs Make in the United States?
GOOD magazine’s most recent transparency contest asked designers to focus their powers on…
-
When Twitter Says Good Morning Around the World
Jer Thorp, an artist and educator from Vancouver, Canada, visualizes when people “wake…
-

An Addiction to Charts and Graphs
Haha, Jason Segel is hilarious. In this episode of How I Met Your…
-
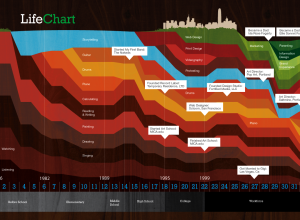
One Life, One Stacked Area Chart
Ben Fogarty uses a stacked area chart to represent his life. To us…
-

Is 10/GUI the Future Replacement of the Mouse and Keyboard?
10/GUI, a prototype interface by R. Clayton Miller, is a new way of…
-

Make Your Walls Way Cooler With Data
Like I said, data graphics that aren’t interactive are a lot better in…
-

The S&P 500 as a Planetary System
The Stock Ticker Orbital Comparison, or STOC for short, from media student James…
-
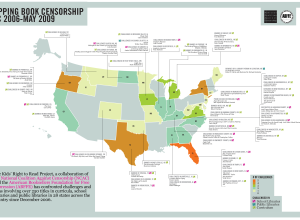
You Are Not Allowed to Read this Book
What would a freshman English class be without Of MIce and Men? No…
-
The Geography of Job Loss
While on the topic of job loss and unemployment, here’s an animated map…
-
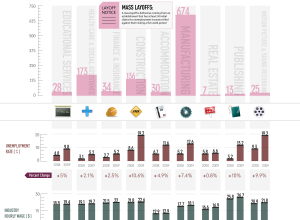
Mass Layoffs by Industry
As we all know, many people, much more than usual, have lost their…
-
Best of FlowingData: September 2009
Again, FlowingData had another record month in terms of growth, and I cannot…
-
Join Us in Atlantic City this Sunday – VisWeek Workshop
Like I mentioned before, Robert Kosara (EagerEyes), Andrew Vande Moere (information aesthetics) and…
-
Trendsmap Shows Twitter Trends Geographically
Twitter shows trending topics, but it’s for the entire user base. You can…
-
NYC BigApps Competition – $20k In Prize Money
It’s exciting times for data heads. The launch of Data.gov back in May…
-
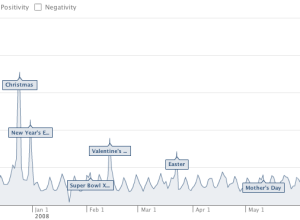
Facebook Measures Happiness in Status Updates
As we all know, Facebook lets people update their friends with status updates,…
-
How Long People Live in America
In this graphic, we take a look at some data on how long…
-
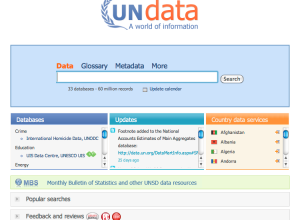
30 Resources to Find the Data You Need
Let’s say you have this idea for a visualization or application, or you’re…
Recently for Members
Second Edition
 Visualize This: The FlowingData Guide to Design, Visualization, and Statistics (2nd Edition)
 Visualize This: The FlowingData Guide to Design, Visualization, and Statistics (2nd Edition)
New tools, refined process.
Browse by Chart Type See All →


