Did we all see this? Phillip Niemeyer of Double Triple pictures the past…
-
Charting the Decade
-
Merry Christmas, and See You Next Year
Merry Christmas, everyone! I hope you’re having a great holiday season so far.…
-
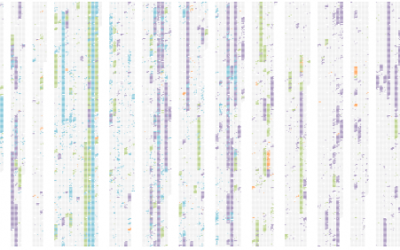
The Decline of Maritime Empires
This experiment (below) by graduate student Pedro Miguel Cruz shows the decline of…
-
Elastic Lists Celebrates Five Years of Information Aesthetics
In celebration of Information Aesthetics’ birthday, Moritz Stefaner of Well-formed Data adapted his…
-
Build Statistical Graphics Online With ggplot2
Statisticians are generally behind the times when it comes to online applications. There…
-
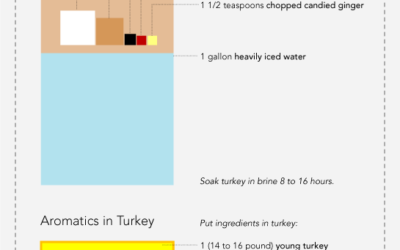
Data Underload #2
Merry Christmas, Bedford Falls! Merry Christmas you old Savings and Loan!
-
Virtual Slot Machine Teaches the Logic of Loss
This interactive by Las Vegas Sun describes how in the long run, you’re…
-
Best of FlowingData 2009, and What to Expect in 2010
It was another interesting and sometimes exciting year for FlowingData. To think, I…
-
Infographic Coins for International Visitors
You know when you go to another country and have no clue what…
-
5 Best Data Visualization Projects of the Year – 2009
It was a huge year for data. There’s no denying it. Data is…
-
Thank You FlowingData Sponsors
Thank you sponsors. You keep FlowingData up and running, and I wouldn’t be…
-
Canvi & Temps: An Exploration of Science Over Time
Bestiario, the group behind 6pli and a number of other network projects, released…
-
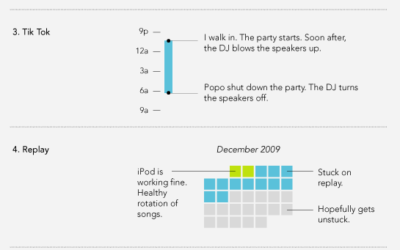
Data Underload #1
Listening to music is overrated.
-
Twitter Mentionmap and Correlations at your.flowingdata
your.flowingdata got a couple of cool updates recently. One is based on your…
-
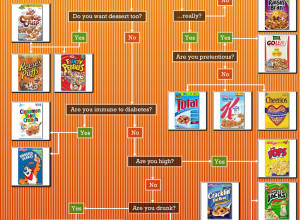
Flowchart Helps You Decide What Cereal to Eat
I bet you wake up every morning wishing, “I wish there was an…
-

Afternoon Thread: Best Visualization of 2009?
The end of 2009 is looming, and it’s about time to make this…
-
Microsoft Live Labs Pivot: Interact With Massive Amounts of Data
What if you could see all the individual bits of information scattered across…
-
How to Make an Interactive Area Graph with Flare
You’ve seen the NameExplorer from the Baby Name Wizard by Martin Wattenberg. It’s…
-
Nebul.us Shows You Your Activity on the Web
Nebul.us is an online application, currently in private beta, that aggregates and visualizes…
-
8 Great Gifts for Your Data Geek
The gift-giving season is here, and you’re probably wondering what to get everybody.…
Recently for Members
Second Edition
 Visualize This: The FlowingData Guide to Design, Visualization, and Statistics (2nd Edition)
 Visualize This: The FlowingData Guide to Design, Visualization, and Statistics (2nd Edition)
New tools, refined process.
Browse by Chart Type See All →


