Visualization for Clarity
Help people understand what data has to say, because it rarely speaks for itself.
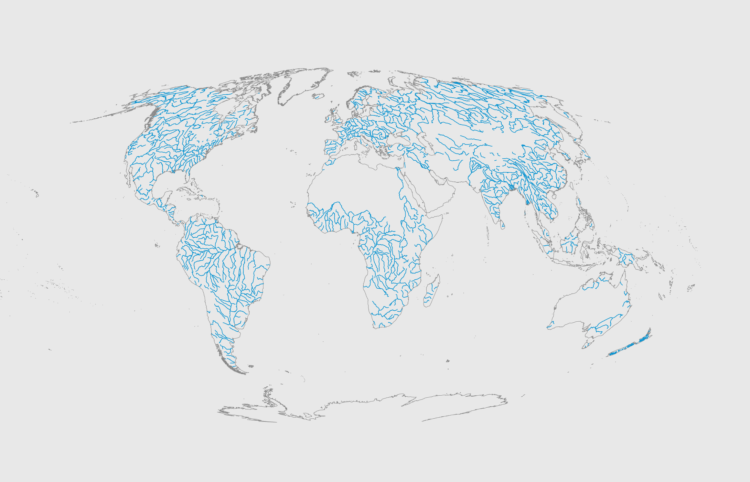
Maps in R
There are many ways to map geographic data in R, and with all the packages available, it can seem like a hodgepodge of items with no clear spot to begin. This doesn’t have to be the case.
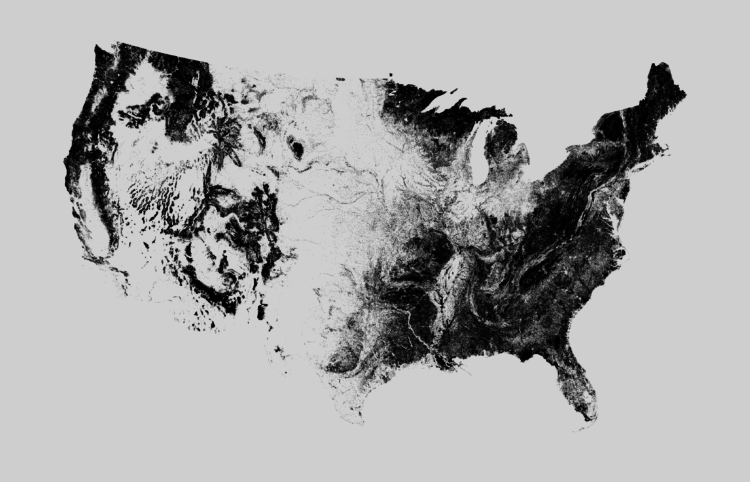
Mapping Geographic Data in R, with ggplot2
Step-by-step instructions on how to work with geographic data and make different kinds of maps, in a familiar package.
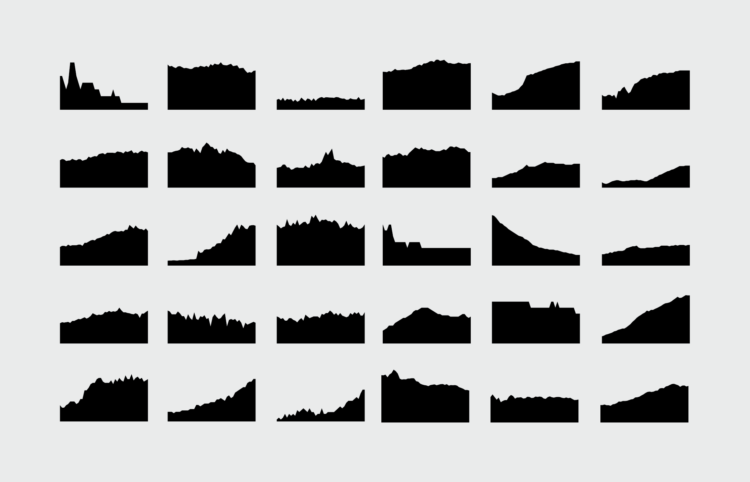
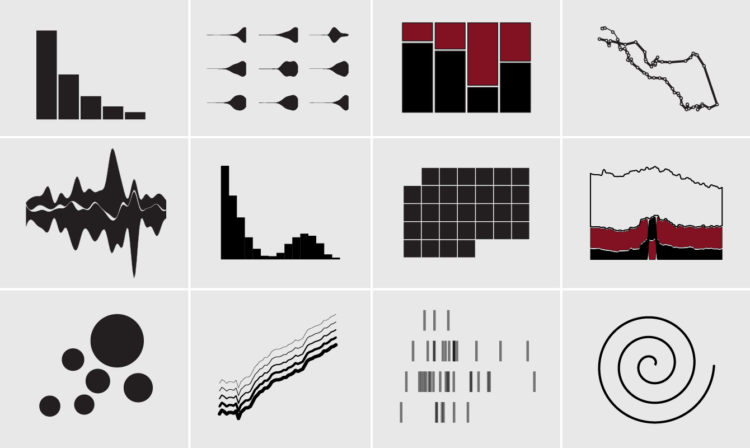
Visualizing Time Series Data in R
Everything you need to know to see and show patterns over time, from basic chart types to the more advanced.