I majored in computer science. I hated it. I ran from it like…
-
It’s Time for Another FlowingData 10k Giveaway – Quick Deadline
-
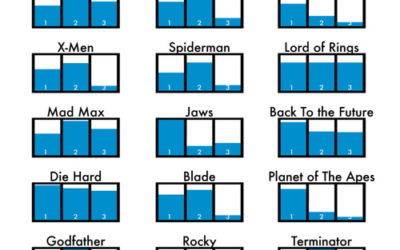
Because It’s Friday: The Trilogy Meter
Dan Meth plots out the trilogy meter – a series of charts that…
-
WallStats’ Death & Taxes Poster – Three Chances to Win!
Where does all of our tax money go? Well, here’s your chance to…
-
The Universe in 2009 from Seed Magazine
Seed Magazine, a publication dedicated to cool things in science, give us The…
-
Visualize This: 10k Giveaway Edition – FusionCharts Licenses Up For Grabs!
This is a special edition of Visualize This. Why? I’m glad you asked.…
-
Obama Launches Recovery.gov – Your $787 billion at Work
The Barack Obama administration is clearly making an effort to get information out…
-
First Giveaway… a Tableau Software Personal Edition!
It’s time for the first competition of our 10k giveaway. Not only is…
-
$3,000 FlowingData 10k Giveaway – Prizes and Sponsors
Alright, let’s get this giveaway going. I hope you’re all as excited about…
-
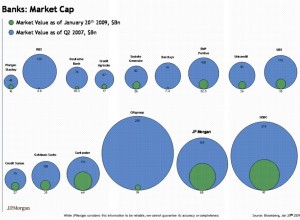
Fail: Area Circles on Wall Street
I know next to nothing about the economy, stocks, and investments, but I…
-
$3,000 Worth of Prizes in FlowingData 10k Giveaway!
Earlier last week, FlowingData reached a long-awaited milestone – 10,000 subscribers. This obviously…
-
Decide What to Do For Her On Valentine’s Day
Valentine’s Day can be tricky. Do you get her flowers? Chocolate? Is it…
-

Open Thread: Is Google Latitude Dangerous?
Google recently released Google Latitude, which is an online application that lets you…
-
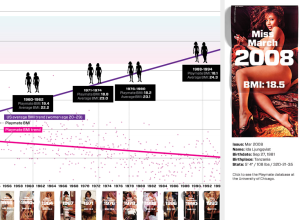
Wired Relates Playboy Playmate BMI and Average BMI, 1954-2008
Playboy playmates continue to be a point of fascination. Remember that study on…
-
Alternate View of Obama’s $819 billion Stimulus Package
OK, so we saw CreditLoan’s representation of Obama’s stimulus package. Here’s Washington Post’s…
-
CreditLoan Maps Out Obama’s Economic Stimulus Plan
President Barack Obama has a $800 billion+ economic stimulus package in the works.…
-
USA Today Digs Into Job Forecasts for 2009
While on the topic of job losses, USA Today provides a look into…
-
4 Different Looks at Job Losses During Recessions
There are so many ways that you can cut a dataset whether it…
-
MIX Online Explores Visualization in Project Descry
MIX Online, a community of designers and developers, released Project Descry – a…
-
A Few More Days Left for Visualize This
A quick reminder – there are about 5 days left for Visualize This:…
-
Flickr Operations Engineer Manager on Graphs and Data Obsession
We’re quite addicted to data pr0n here at Flickr. We’ve got graphs for…
Recently for Members
Second Edition
 Visualize This: The FlowingData Guide to Design, Visualization, and Statistics (2nd Edition)
 Visualize This: The FlowingData Guide to Design, Visualization, and Statistics (2nd Edition)
New tools, refined process.
Browse by Chart Type See All →


