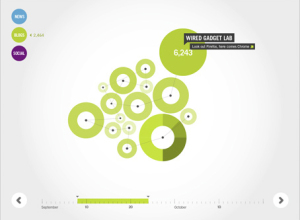
The Eigenfactor Project and Moritz Stefaner collaborate in these interactive visualizations “based on…
-
Ranking and Mapping Scientific Knowledge – eigenfactor
-
Best of FlowingData – January 2009
FlowingData has seen a lot of new readers in the past couple of…
-
George Dubya Bush Bull’s-eye
Linda Eckstein sent this graphic along to show the main ideas of Russ…
-
What’s the Weather Like In Your City?
Cincinnati’s local NBC news provides viewers with a customizable weather dashboard. Look up…
-
New York Times Maps Twitter Chatter During Super Bowl
Twitter and maps just go well together. The New York Times maps Super…
-
Thank You, FlowingData Sponsors
The past couple of months have been pretty exciting here on FlowingData. We…
-

Open Call to Designers: Visualizing Mozilla Community
The Mozilla group is starting to dig into visualization to participation within the…
-
Mapping and Animating Growth of Target Across United States
After I produced a map that shows the growth of Walmart, there were…
-
Visualize This: Piracy for Oscar-nominated Movies
The first Visualize This for poverty rate in America was a very good…
-
Showcase of Student Personal Annual Reports
Some of the best stuff comes out of student projects. During the Screendesign…
-
Data Visualization Sketches for Google Search Results
Grid/plane, a studio centered in Portland Orgeon, collaborated with Instrument, to visualize media…
-
Last Day to Put in Your Entry for Visualize This – Vote Now
A quick reminder: tomorrow is the last day to put in your entry…
-
Why Do Freeways Come to an Annoying Hault?
The worst thing about Los Angeles is the traffic hands down. As you…
-
Heavy Metal Band Names Flow Chart
Doogie Horner from Comic vs. Audience created the above flow chart for heavy…
-
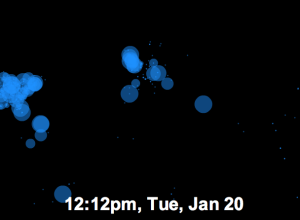
Visualizing Twitter as Barack Obama Became the 44th President
On Tuesday, January 20, 2009 at 12pm, Barack Obama officially became the 44th…
-
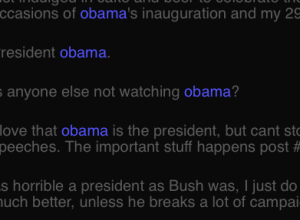
Twistori for the Inauguration
Remember Twistori? It’s the Twitter mashup that shows tweets of love, hate, think,…
-
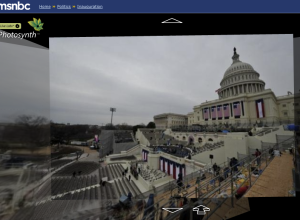
Photosynth from the Inaugural Stands on MSNBC
The Photosynth of first-hand reader photographs is now up on MSNBC. If you’re…
-
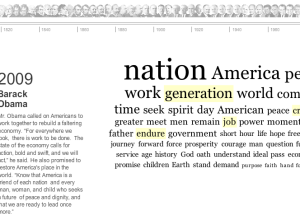
Inaugural Words From 1789 to Present
There’s a lot going on today, and of course the news interactive teams…
-
Guide to Inauguration Day
It’s Inauguration Day! There’s a happy buzz in the air, and you can’t…
-
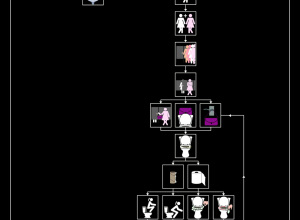
Man vs Woman, Decision-making for Goldstar Beer
These ads for Goldstar beer were hung above bar toilets. They’re comical flow…
Recently for Members
Second Edition
 Visualize This: The FlowingData Guide to Design, Visualization, and Statistics (2nd Edition)
 Visualize This: The FlowingData Guide to Design, Visualization, and Statistics (2nd Edition)
New tools, refined process.
Browse by Chart Type See All →


