The infographics and news design blogs have been buzzing the past few days…
-
New York Times Shines at International Infographics Awards
-
Facebook: On the Road to 200 million Users
As we learned last week, Facebook has been growing worldwide ever since it…
-
FlowingData Projects is Now Live, Plus New Growth Map
I finally got around to putting all the FlowingData projects together. As many…
-
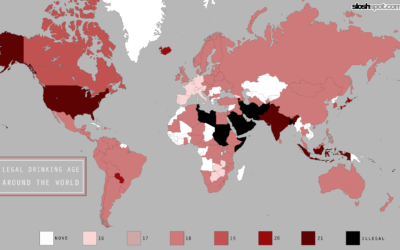
Legal Drinking Age Around the World
While we’re on the topic of beer (it is Friday after all), let’s…
-
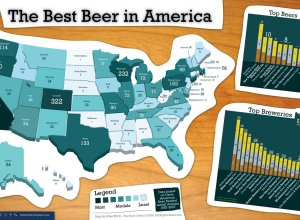
Where Can You Find America’s Best Beer?
Mike Wirth maps medal winners from the Great American Beer Festival from 1987…
-
Check In on the State of the Economy
This interesting chart from Russel Investments shows the current state of the economy…
-
Explore Multiple Time Series in Third Dimension
Roland Lößlein, a media student at University of Applied Sciences in Augsburg, presents…
-
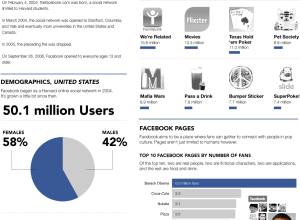
Taking a Look at Facebook Statistics from All Facebook
Facebook started as a spinoff of Hot or Not in 2003. Now Facebook…
-
Little Red Riding Hood, the Animated Infographic Story
Tomas Nilsson, a graphic design student from Linköping University, tells the story of…
-
AIG Bailout: Where $173 billion Went
Nicolas Rapp and Damiko Morris of Associated Press delve into the AIG bailout.…
-
Data Visualization is Only Part of the Answer to Big Data
How can we now cope with a large amount of data and still…
-
Social Weather Mapping From Google Chrome Experiment
In the promotion of its speedy javascript, Google announces the Chrome Experiment. As…
-

Bus Bench is an Infographic of Guilt
I’ve given a few talks on my work with self-surveillance, and there is…
-
FlowingData NCAA Tournament Bracket – Try and Beat Me
I just started the FlowingData NCAA tournament bracket. Join now. Try and beat…
-
One Song Sang By 2,088 Voices – Mechanical Turk Rendition
Aaron Koblin and Daniel Massey team up to give us Bicycle Built for…
-
Review: Data Flow, Visualizing Information in Graphic Design
Data Flow: Visualizing Information in Graphic Design isn’t an Edward Tufte book. It’s…
-

Do You Want to Learn How to Make Statistical Graphics?
If you’re interested in learning how to use R for statistical graphics or…
-
27 Visualizations and Infographics to Understand the Financial Crisis
I’ve said it before, and I’ll say it again. If there’s anything good…
-
Thank You, FlowingData Sponsors
It’s been an interesting month on FlowingData. We celebrated 10,000 readers not too…
-
Immigration Explorer Shows Largest Foreign-born Groups Since 1880
Remember our short contest a while back with immigration rates to the United…
Recently for Members
Second Edition
 Visualize This: The FlowingData Guide to Design, Visualization, and Statistics (2nd Edition)
 Visualize This: The FlowingData Guide to Design, Visualization, and Statistics (2nd Edition)
New tools, refined process.
Browse by Chart Type See All →


