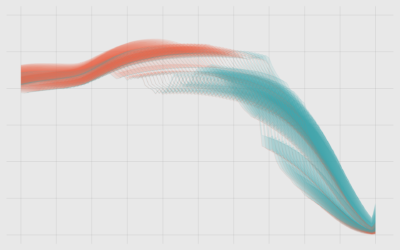
A specialized line chart, this chart type highlights the change in rank or metric over two time periods.
Let's work through a practical example to see how asking and answering questions helps guide you towards more focused data graphics.
Also known as specialized or custom line charts. Figure out how to draw lines with the right spacing and pointed in the right direction, and you've got your slopegraphs.
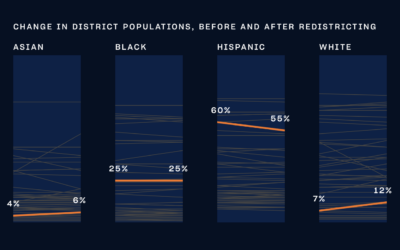
With New York 2023 elections coming up, The City and NY1 put together…
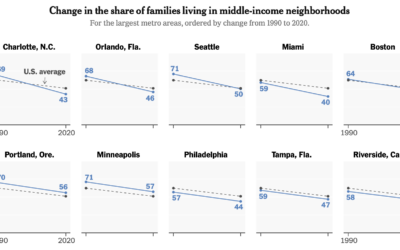
Income distribution continues to stretch on the high end and squish on the…
Denise Lu and Albert Sun for The New York Times show the shifts…
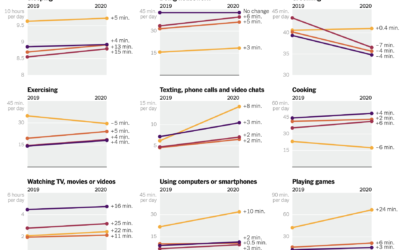
Our everyday routines changed over the past year, and with the 2020 American Time Use Survey, we can see by how much.
Ben Casselman and Ella Koeze for The New York Times compared time use…
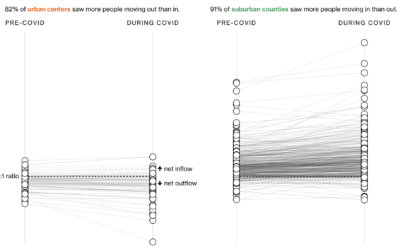
In another look at migration through the lens of USPS change of address…
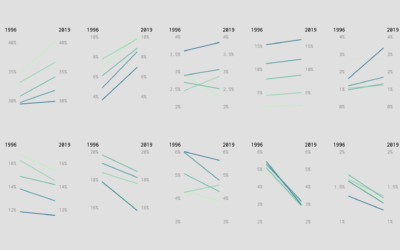
I compared spending in 1996 against the most recent spending estimates from the Bureau of Labor Statistics.
I compared time use for those with children under 18 against those without. Here's where the minutes go.
Facebook took the biggest hit in the past three years. Snapchat and Instagram got more likes.
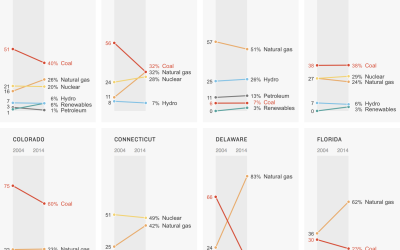
A clean and simple set of slope charts to show the change between 2000 and 2014.
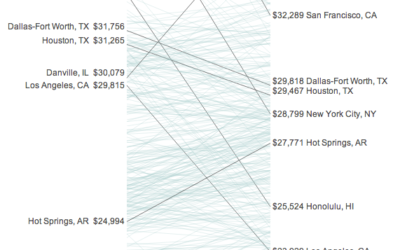
Incomes and the cost of living vary across the country. Some areas might…
A few years ago I downloaded speed dating data from experiments conducted by…