I was going to let this one slide, but people kept commenting, essentially…
-

Narrow-minded Data Visualization
-
Visual Representation of Tabular Information – How to Fix the Uncommunicative Table
This is a guest post by Martin Krzywinski who develops Circos, a GPL-licensed…
-
Jobs Vanish Across Our Country
As a nation, we gained jobs every month during 2007 compared to the…
-

‘I Love Charts’ from Sid the Science Kid
It’s good to see PBS is teaching strong values to grow up with…
-
Thank You, FlowingData Sponsors
FlowingData continues to grow at a faster and faster rate each month, and…
-

Visualize This: Days Spent Working to Pay Taxes
It’s time for another segment of Visualize This. For new readers, this is…
-
Creating a World in Holograms
This holographic video by Bruce Branit is completely fictional but oh so sexy.…
-

Millions of Money-in-Politics Data Records Now Available
The Center for Responsive Politics (CRP), a research group well-known for its tracking…
-
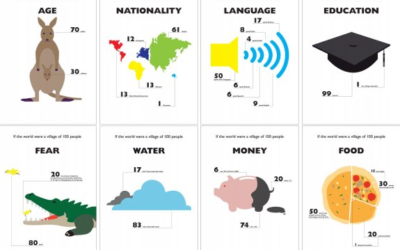
Demographics in World of 100
Designers seem to have taken a liking to the idea of showing world…
-
Geography of Buzz In Los Angeles and New York
Elizabeth Currid (USC) and Sarah Williams (Columbia University), collaborate to map the geography…
-
Campaign Contributions to the 110th Congress
This network graph shows common contributions between representatives in Congress:
A relationship exists… -
Zappos Maps Sales in Real-time
Zappos, the online shoe retailer, maps sales across the United States in real-time.…
-
Web Trends Map from Information Architects, 4th edition
Information Architects, a design firm with offices in Japan and Zurich, release their…
-
Sprint Commercial Tells Us What’s Happening Right Now
Sprint’s “now” promotion seems to be in full swing. In line with their…
-

A Perfect Personal Data Collection Application
The number of Web applications to collect data and information about yourself continues…
-
24 Hours of Geotagged Photos on Flickr
Daniel Catt from Flickr maps 24 hours worth of geotagged photos (about 64,000…
-
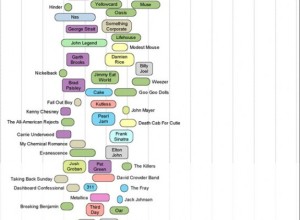
Music That Makes You Dumb
Virgil Griffith, a CalTech graduate student, follows up books that make you dumb…
-
Make This Sitcom Map More Informative
This map from Dan Meth displays popular sitcoms by where they took place.…
-
Data.
Dear reader,
After much thought and arguments with myself, I’ve decided to quit… -
Phrase Net Shows the Secret Life of Words
Many Eyes, the social data analysis site, released another visualization tool – Phrase…
Recently for Members
Second Edition
 Visualize This: The FlowingData Guide to Design, Visualization, and Statistics (2nd Edition)
 Visualize This: The FlowingData Guide to Design, Visualization, and Statistics (2nd Edition)
New tools, refined process.
Browse by Chart Type See All →


