RealLifeLore explains the history between the two countries and the multi-faceted motivations behind the invasion. As you might expect, the reasons are complex and full of unknowns.
-
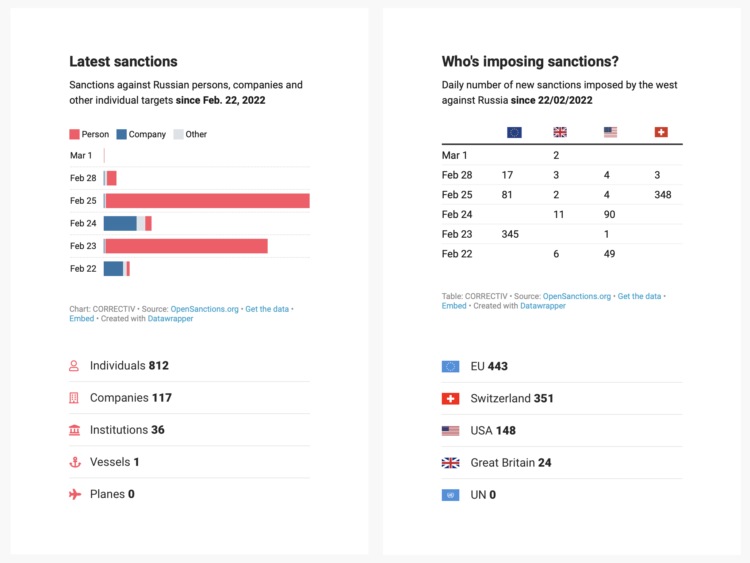
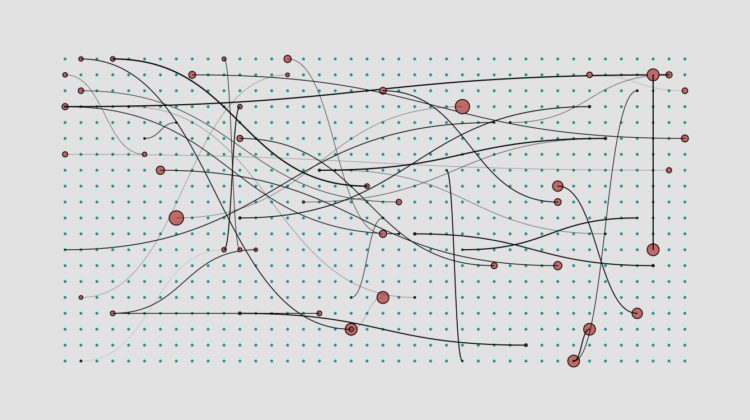
Correctiv is tracking sanctions against Russian individuals and companies, based on data from OpenSanctions.
-
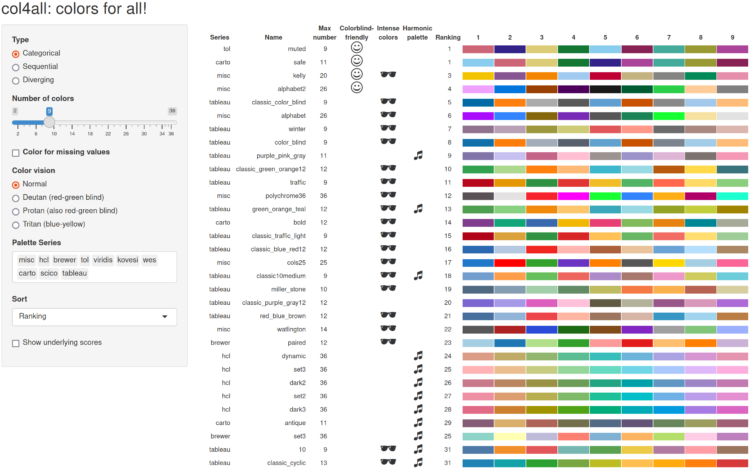
If you use color as a visual encoding, you should make sure every one can actually see the differences in your scale. The cols4All package from Martijn Tennekes can help by ranking and categorizing a wide set of color schemes.
Color palettes are well organized and made consistent with each other. Moreover, they are scored on several aspects: color-blind-friendliness, the presence of intense colors (which should be avoided), the overall aesthetic harmony, and how many different hues are used. Finally, for each color palette a color for missing values is assigned, which is especially important for spatial data visualization. Currently we support three types: categorical (qualitative) palettes, sequential palettes, and diverging palettes. In the near future, more palette types will be added, such as cyclic, bivariate, and hierarchical.
-
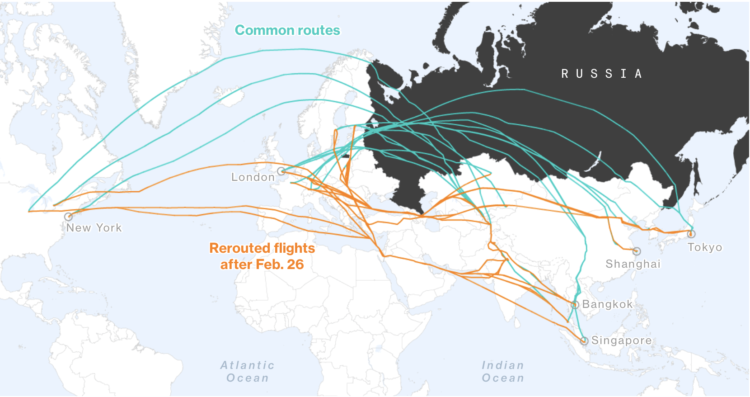
Many countries have banned Russian aircraft from entering their airspace. Russian in turn has banned other countries. For Bloomberg, Mira Rojanasakul and Jin Wu mapped current bans and showed how flights have had to reroute.
-
In the 1970s, the most common household type in the U.S. was a married couple with kids. But over time, as people wait longer to get married and have fewer kids (if any), it’s grown more common to live alone or with non-family.
-
As we know by now, conservatives in the U.S. are more commonly against getting vaccinated for Covid, but it wasn’t always like that. Vox shows how ideas shifted to get to where we are now.
The 1990s elementary school aesthetic with markers and overhead projector slides works well here. The choices guide you step-by-step through the data points.
-
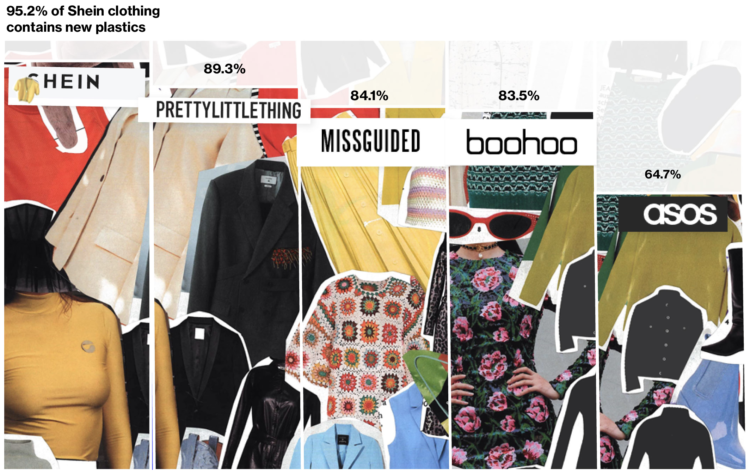
For Bloomberg, Rachael Dottle and Jackie Gu look at the current state of the fast fashion industry, which uses petroleum-derived polyester in most of the clothing:
Almost every piece of clothing we buy is made with some polyester, the data shows. Although the dataset is made up of mostly fast fashion retailers, it’s not just fast fashion that loves polyester. Lululemon joggers? Polyester, nylon and elastane. Gucci skirt? Polyester.
I like the scrapbook theme and the digital garbage falling down the screen as you read. There’s also a counter that roughly estimates the number of clothing items thrown to the trash since you started reading.
-
Members Only
Here’s the good stuff for February.
-
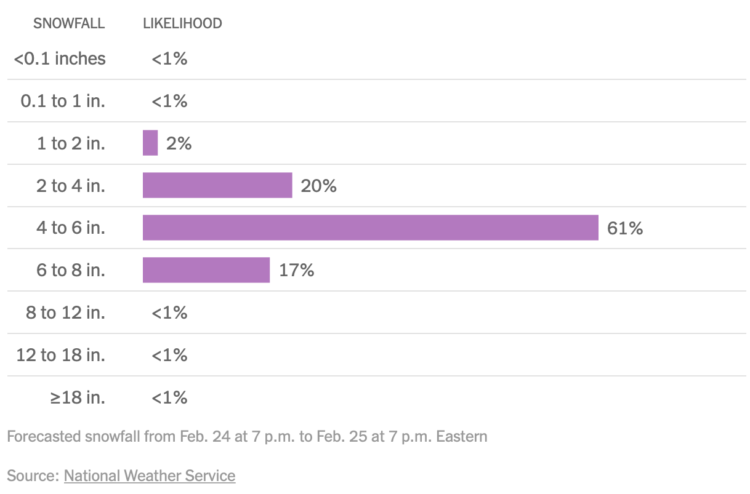
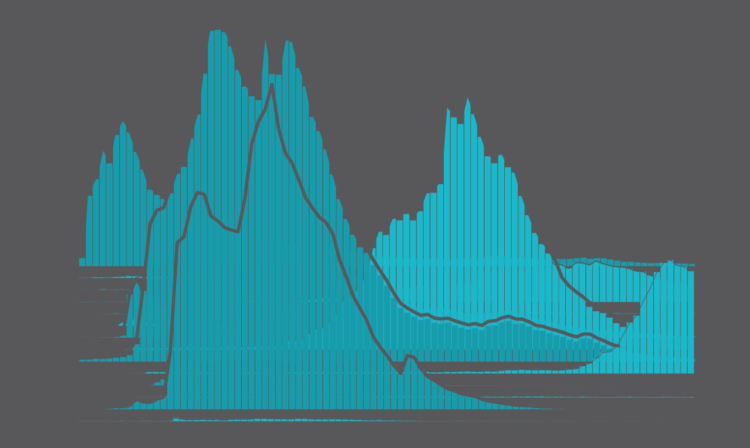
For NYT’s The Upshot, Aatish Bhatia, Josh Katz and Margot Sanger-Katz show the full distribution of expected snowfall in your area instead of just the middle:
The range can be wide. That’s because predicting snow remains tricky, especially several days out, said Alex Lamers, a warning coordination meteorologist at the National Weather Service. Getting a snowfall total right requires predicting the path of a storm correctly, estimating the amount of precipitation and understanding additional factors — like the temperature high in the atmosphere, or wind speeds close to the ground — that can influence the snow’s density.
The Weather Man with Nicolas Cage is such an underrated movie.
-
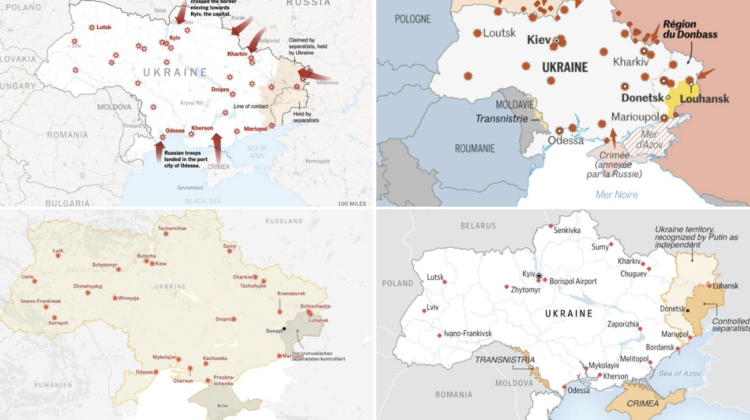
There are many maps trying to show what is happening in Ukraine right now. Lisa Charlotte Muth is keeping a running thread.
-
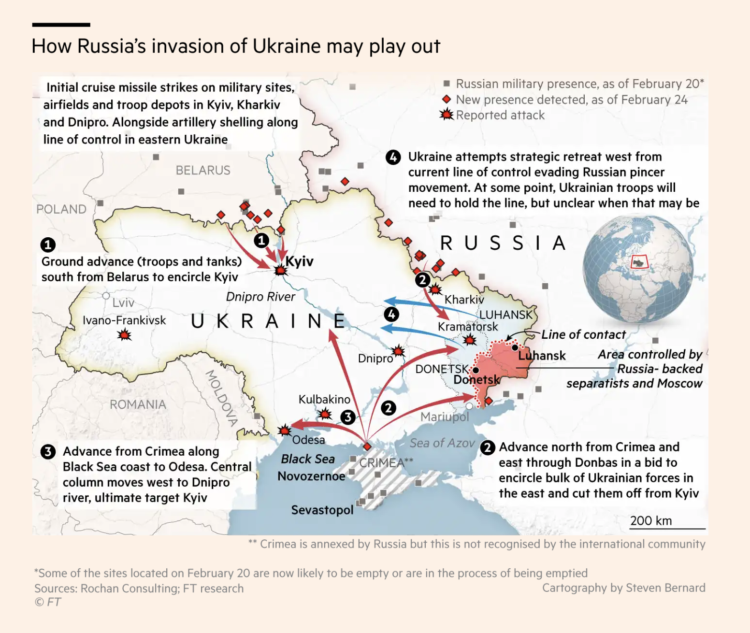
This map by Henry Foy and Steven Bernard for Financial Times shows a timeline of Russian military presence. The gray squares represent a presence as of February 20, red diamonds represent a presence four days later, and bang symbols represent reported attacks.
-
For Wired, stat professor Jeffrey Rosenthal answered statistics questions from Twitter, such as how likely it is you win the lottery, why election polls seem wrong all the time, and how statistical testing works. This was an entertaining and educational 16 minutes.
-
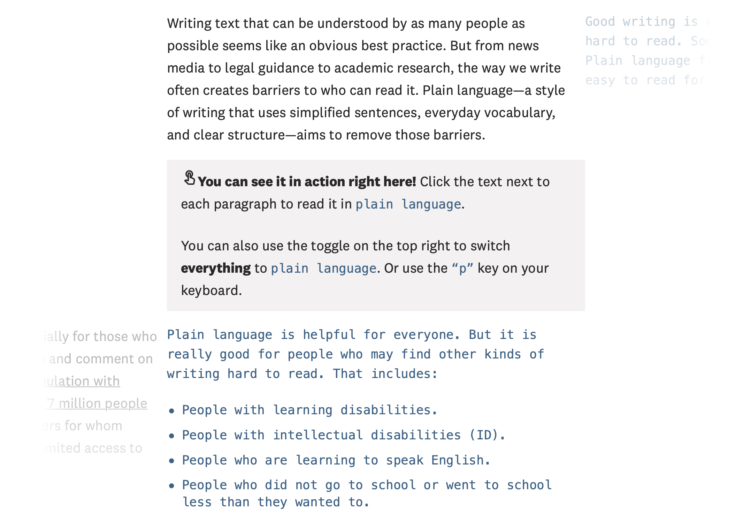
For The Pudding, Rebecca Monteleone and Jamie Brew (with design and code by Michelle McGhee) describe the advantages of more readable writing and how we measure readability. The best part is that they demonstrate with two versions of text. Switch paragraph-by-paragraph to see how an explanation is made more clear with simpler words and sentence structure.
This is what I was trying to get at with last week’s Process newsletter but much better.
-
Baby names gain sudden popularity for various reasons. Maybe a celebrity with a unique name gains traction, or a character in a movie strikes a chord with audiences. Maybe an athlete reaches the peak of fame, and expecting parents have similar dreams.
I wondered how these trends changed over time. So using data from the Social Security Administration, I found the most trendy baby name every year since 1930. Here they are for female and male.
-
Members Only
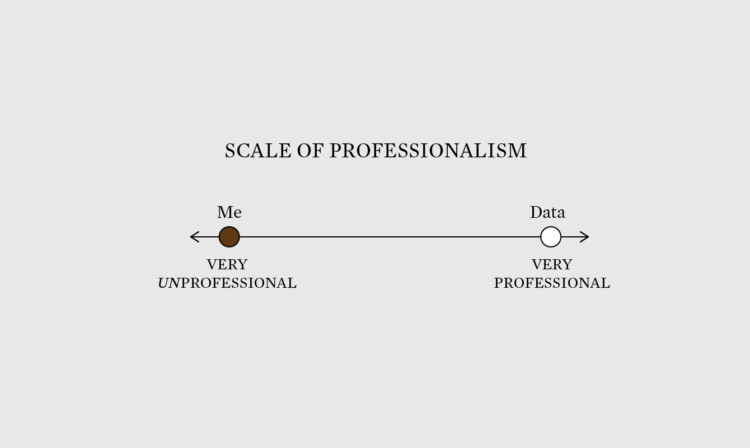
Sometimes being unprofessional works to your advantage when communicating data.
-
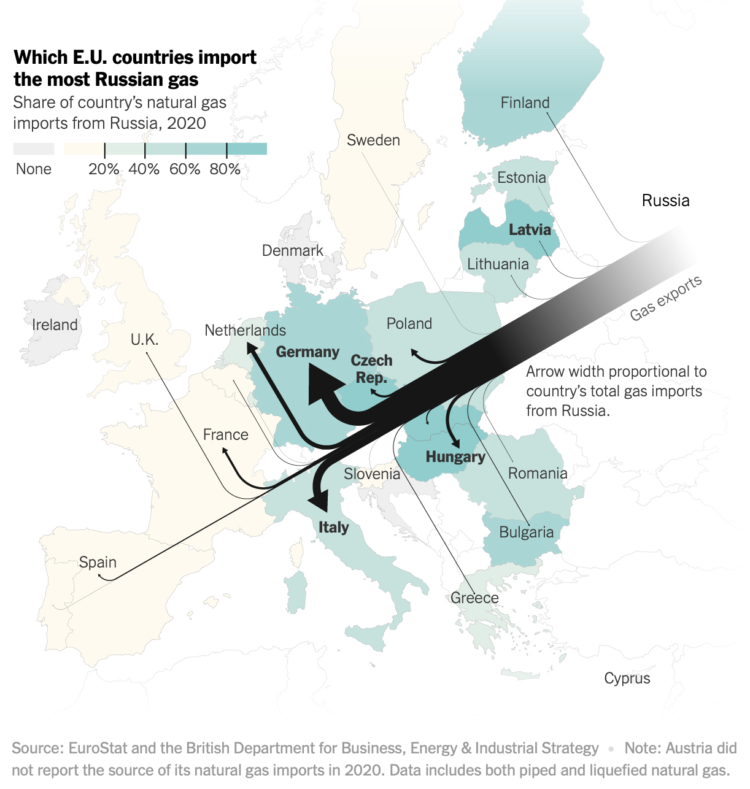
Speaking of Russian gas, Josh Holder, Karl Russell and Stanley Reed for The New York Times mapped gas exports from Russia to E.U. countries. NYT used Sankey flows where thicker lines mean more gas, which are paired with a choropleth map that represents share each country’s natural gas imports that are from Russia.
-
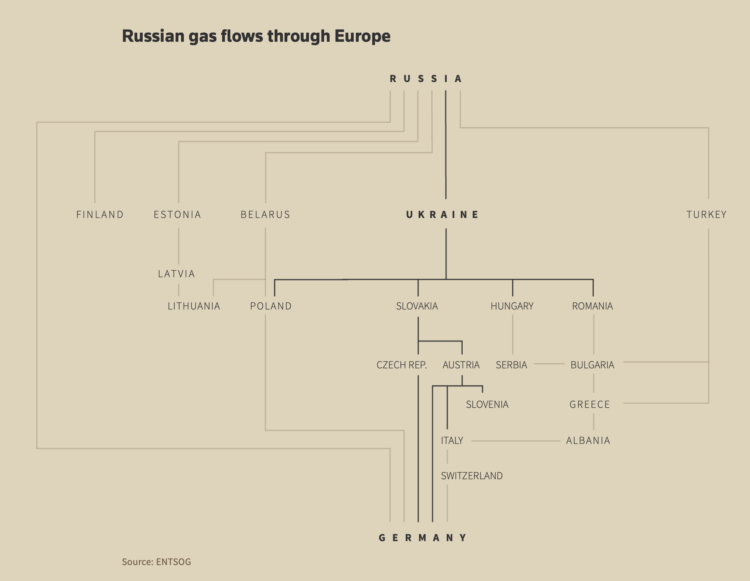
For Reuters, Prasanta Kumar Dutta, Samuel Granados and Michael Ovaska detail Europe’s dependence on Russia’s gas supplies and the crisis in Ukraine:
With its abundant gas reserves, the proximity of its oilfields and an extensive existing pipeline network, Russia dominates the EU’s gas market at about 38% of total supply. Norway, the bloc’s next largest source of natural gas, accounts for half that, just 19% of the market.
The interdependence between Europe and Russia is likely only to deepen with the new Nord Stream 2 pipeline set to double the direct supply of natural gas from Russia to Germany under the Baltic Sea. That is, of course, unless the crisis in Ukraine threatens Nord Stream 2’s regulatory approval process, a potent threat that could scrap the whole project, which the United States and Europe have wielded during negotiations.
-
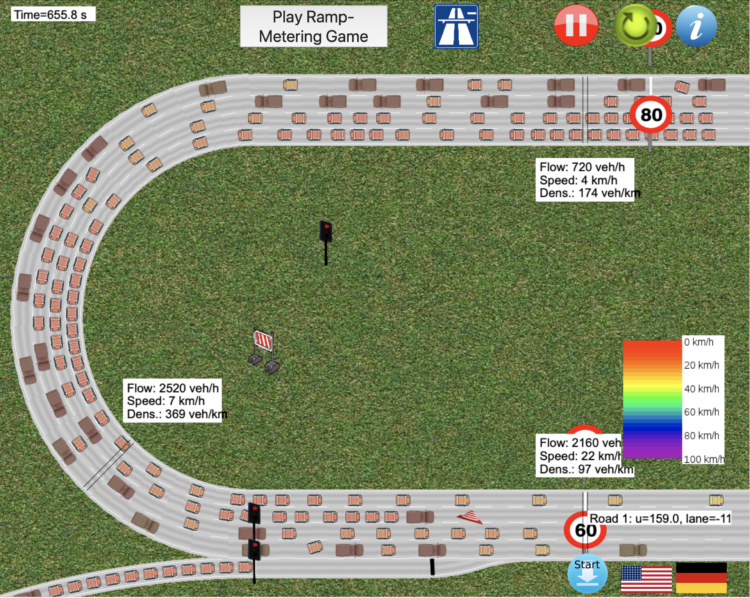
Traffic always seems so sensitive to the smallest disruptions. Someone pulls over to the side of the road? Traffic jam. Slight incline on the freeway? Traffic jam. One person weaving in and out of lanes? Traffic jam. With this traffic simulator by Martin Treiber, you can test out all the possible scenarios.
You can use different types of roads, place speed limits, start construction, increase or decrease the number of lanes, adjust the incline, and even define politeness among drivers. Experience the frustrations of driving, right from your computer. [via kottke]
-
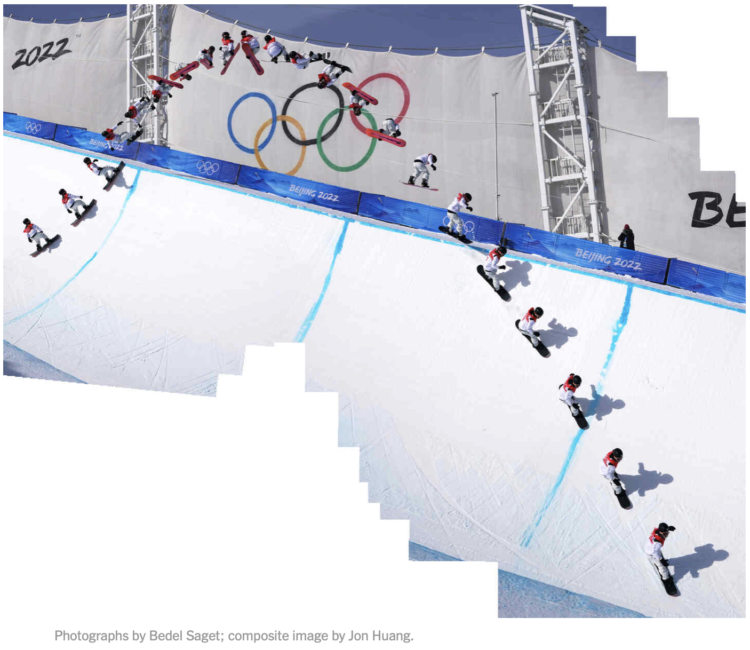
If you watched the men’s halfpipe in the Olympics, you were probably impressed by Ayumu Hirano’s tricks. But it can be hard to see what he actually does in real-time, other than flying high, spinning a lot, and landing cleanly. So The New York Times used composite photos to show Hirano’s trajectory. I especially like the zoom-in frame by frame composite showing a Cab Double Cork 1440.
-
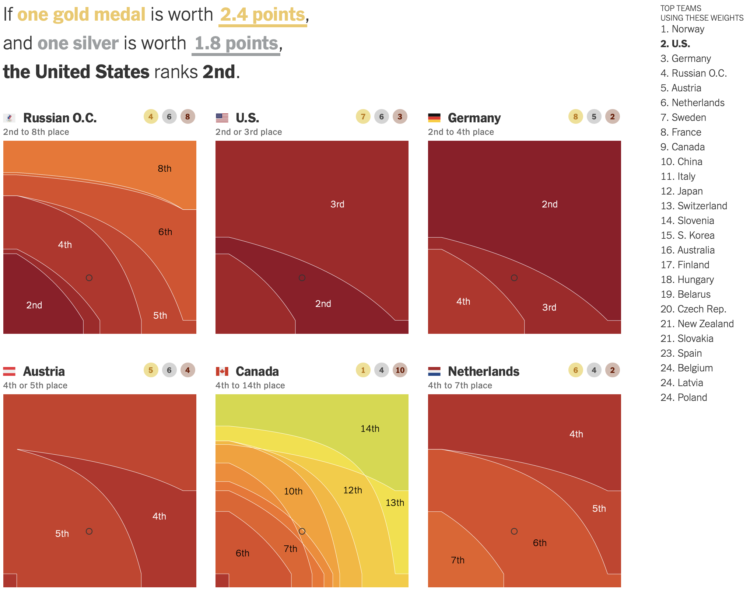
To decide who’s doing best at the Olympics you have to define what “best” means. Do you go by total medal count? Do you give more weight to gold medals over silver and bronze? Josh Katz, for NYT’s The Upshot, has been updating an interactive that ranks countries based on how you answer.
Each heatmap represents a country. The horizontal axis represents how much more a silver is worth over a bronze, and the vertical axis is how much a gold is worth over a silver. So the bottom left corner is all medals equal. Color represents possible ranking. The list of countries on the right updates as you move the cursor over spots.
Katz has been updating for each Olympics since PyeongChang 2018. It’s my favorite medal count tracker. I like the original best, which spaced countries in the list when there were ties.
Recently for Members
Second Edition
 Visualize This: The FlowingData Guide to Design, Visualization, and Statistics (2nd Edition)
 Visualize This: The FlowingData Guide to Design, Visualization, and Statistics (2nd Edition)
New tools, refined process.
Browse by Chart Type See All →


