Last week marked 18 years of FlowingData.
That seems like a long time, especially on the internet. I didn’t know what I was getting myself into.
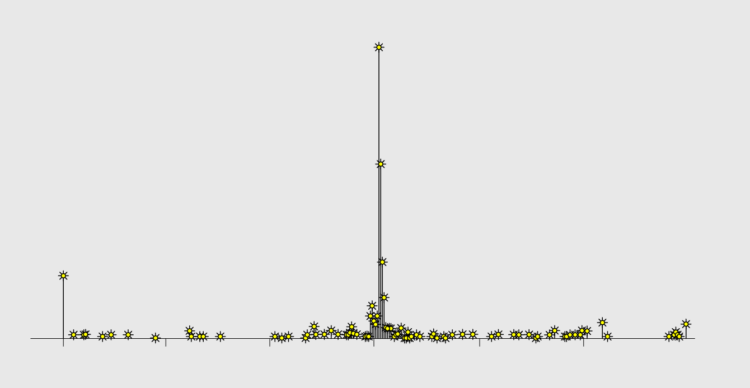
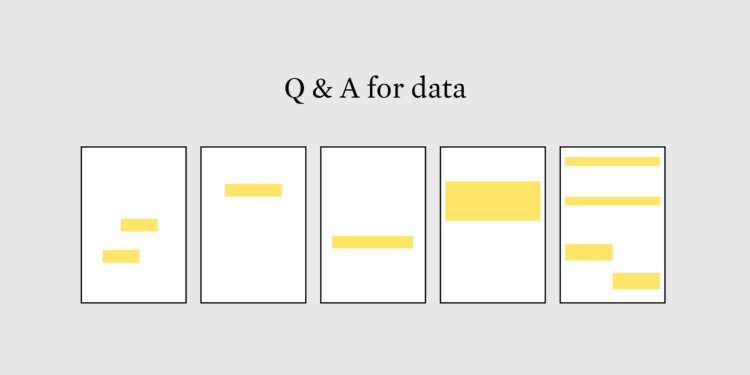
There have been books. There have been many analyses and charts. There have been many shared projects.
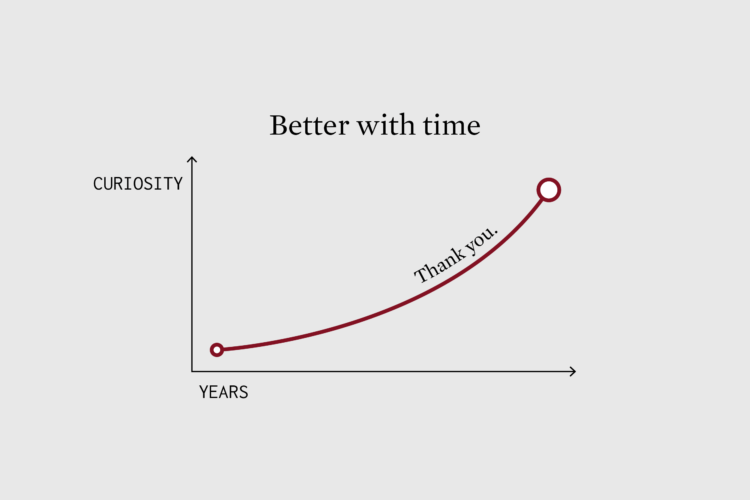
Still, my notebooks overflow and I’m excited about projects in the works. I grow more curious about data, analysis, and visualization with every new project, big and small.
I feel lucky. I feel grateful.
Thank you for reading. Thank you for sharing. Thank you for supporting.
Let’s run it back.


 Visualize This: The FlowingData Guide to Design, Visualization, and Statistics (2nd Edition)


