From Axios, a quick chart that shows consumer sentiment between those with annual…
Axios
-
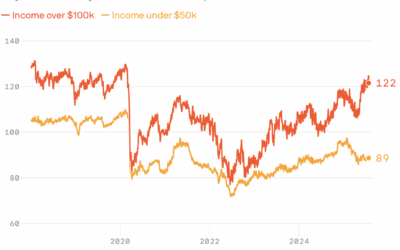
Diverging consumer sentiment
-
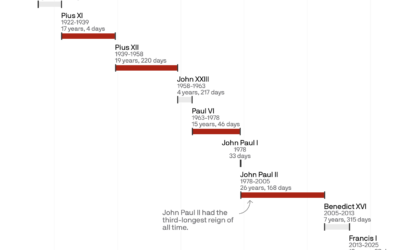
Length of pontificates
Pope Francis’ papacy started in 2013 and lasted 12 years and 39 days.…
-
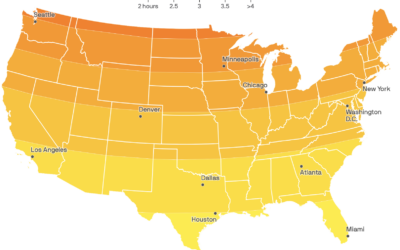
Map of daylight gained in spring
Spring officially started last week here in the Northern Hemisphere. For Axios, Jacque…
-
AI system to revoke student visas
For Axios, Marc Caputo reports:
Secretary of State Marco Rubio is launching an… -
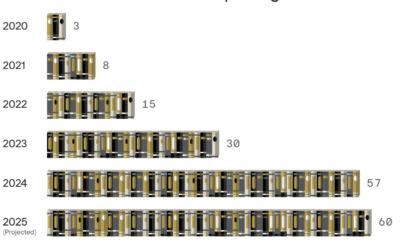
Book chart showing Barnes & Noble opening new stores
I assumed that Barnes & Noble was on its way out, but I…
-
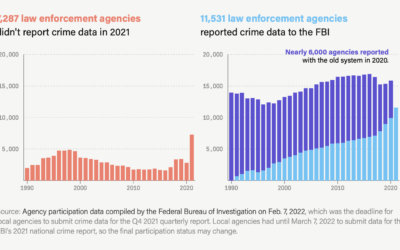
Unreliable FBI crime data
The Marshall Project and Axios report that the FBI changed their reporting system…
-
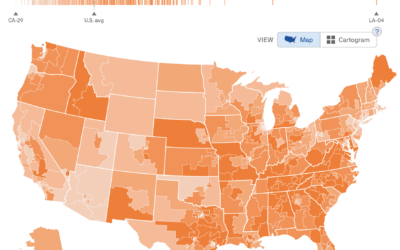
Interest levels for political issues mapped
To estimate public interest in the many political issues across the United States,…
-
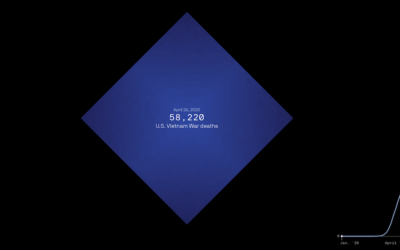
Scale of one million deaths
The United States is about to reach one million confirmed Covid deaths, or…
-
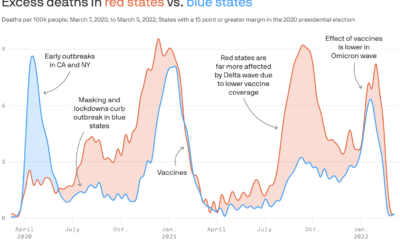
Partisan excess deaths
Excess deaths is the difference between expected deaths based on historical data and…
-
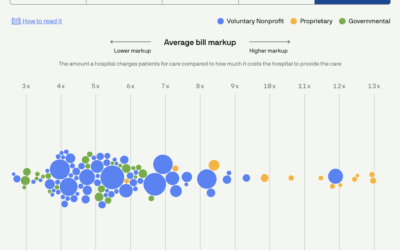
Scoring hospitals by billing quality
Using data collected by Johns Hopkins University, Michelle McGhee and Will Chase for…
-
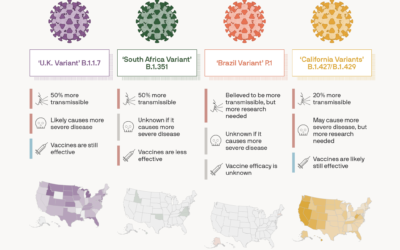
Coronavirus variant tracker
For Axios, Will Chase, with illustrations by Brendan Lynch, provides the current status…
-
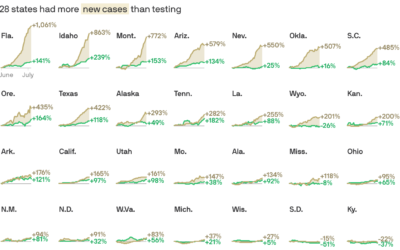
Cases vs. testing
There have been assertions that increased case counts are all from increased testing.…
-
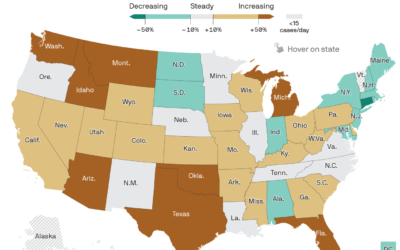
Map of Covid-19 surge
Axios provides a straightforward state map showing the percentage change in the 7-day…
-
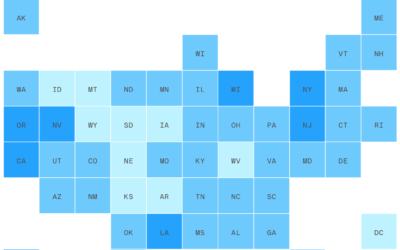
Households that lost income
This straightforward grid map by Danielle Alberti for Axios shows the percentage of…
-
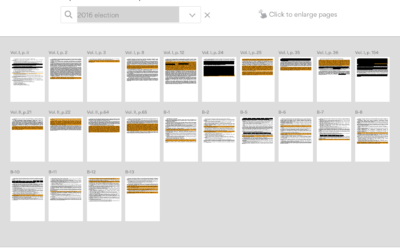
A more detailed view of the Mueller Report
By now we’ve all seen the zoomed out thumbnail view of the Mueller…
-
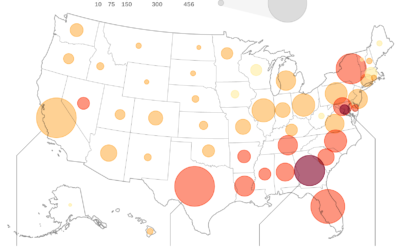
Robocalls map
Other than calls from my wife, I can’t even remember the last call…
-
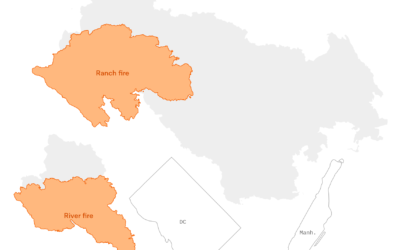
Scale of the California wildfires
The Mendocino Complex Fire, now the largest in California ever, continues to burn.…
-
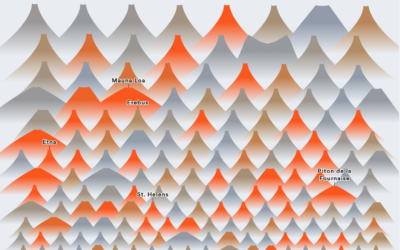
All the volcano eruptions
Slowly becoming the person who charts the past century of natural disaster events,…
-
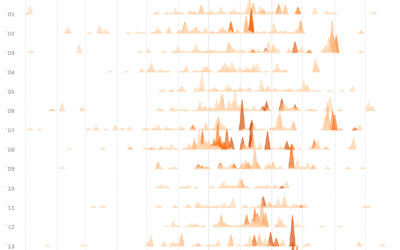
Charting all the major California wildfires since 2000
Based on data from CAL FIRE, Erin Ross, for Axios, plotted California wildfires…
-
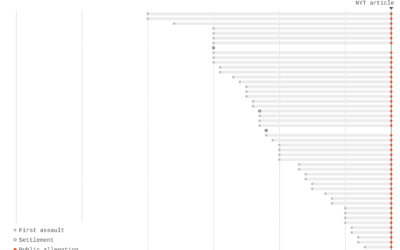
Charts show time between assaults and public allegations
As the list of sexual assault allegations grows for Harvey Weinstein (and many…
Recently for Members
Second Edition
 Visualize This: The FlowingData Guide to Design, Visualization, and Statistics (2nd Edition)
 Visualize This: The FlowingData Guide to Design, Visualization, and Statistics (2nd Edition)
New tools, refined process.
Browse by Chart Type See All →


