Imagine everything on Wikipedia in an infinite museum of galleries. That’s what Maya Claire did, and you can walk through the museum via your desktop computer or in virtual reality.
Read More
-
-
Generative AI is readily accessible these days, which has led to an influx of nice-looking, but impractical beauty inspiration for many. For the Washington Post, Tatum Hunter on what that influx looks like for the stylists tasked with the impossible:
Rita Contreras, a hairstylist in Brooklyn, said that in the past six months, the number of clients walking in with AI images has ballooned. While the fake photos often fool her clients, Contreras can spot an AI image a mile away, she said; the details are too flawless, the hair too glossy.
“I have to just say, ‘This is not a real person. This is not real hair,’” Contreras said. She spends time before each appointment talking clients through the differences between AI hair (immune to bad lighting and weather) and real hair (vulnerable to both).
This reminds me of when my dad, a civil engineer, would come home from work and comment how someone came in with unrealistic building sketches. The plans might look nice, but in reality, the supposed buildings would crumble in an earthquake, if they were able to stand at all.
-
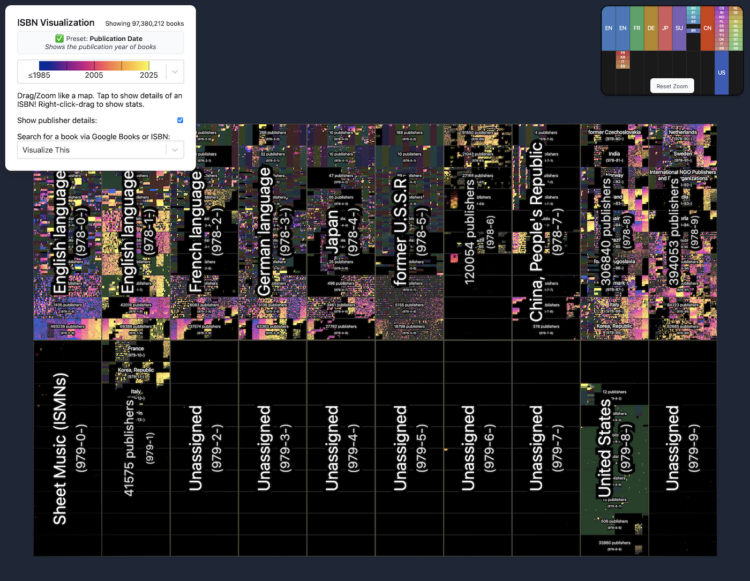
To show a catalog of almost 100 million books in one view, phiresky mapped them based on International Standard Book Numbers, or ISBNs, with an interactive visualization.
Read More -
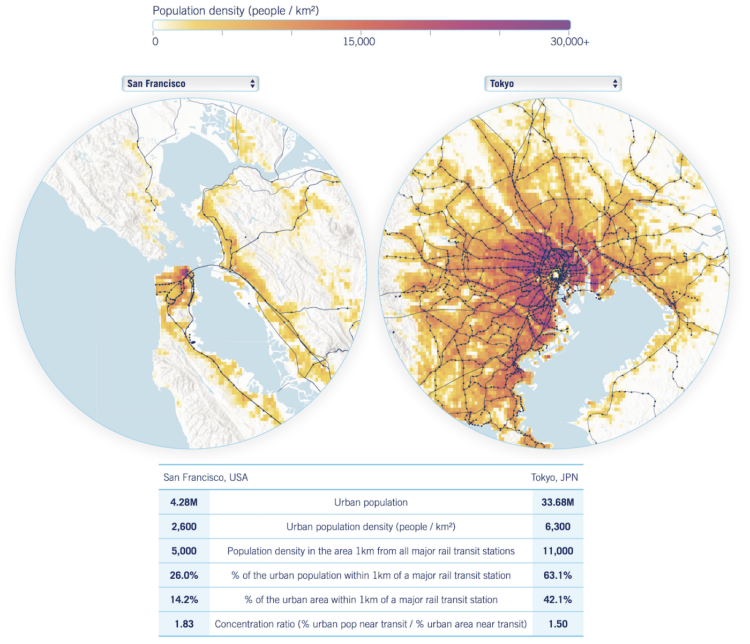
In some cities, a large percentage of the population has access to public transit, whereas in others, access is limited. Aniket Kali and Jeff Allen mapped rail transit on population density and then ranked cities based on the percentages:
Good public transit connects people to places. Ideally, this is done efficiently and sustainably, with transit routes and stations serving and connecting the most amount of people possible. But in reality, there’s a lot of variation within and between cities in how effectively this is done.
To look at this, we’ve created maps of major rail transit lines and stations (rapid transit, regional rail, LRT) overlaid onto population density for 250 of the most populated urban regions around the globe.
By the percentage of population within one kilometer of rail transit, Hong, Osaka, and Madrid ranked highest.
-
Welch Labs explains how the perceptron, an algorithm developed by Frank Rosenblatt in 1950s, is a foundation for current large language models that power chatbots like ChatGPT. You just have to link 100 million or so perceptrons in a single network.
Read More -
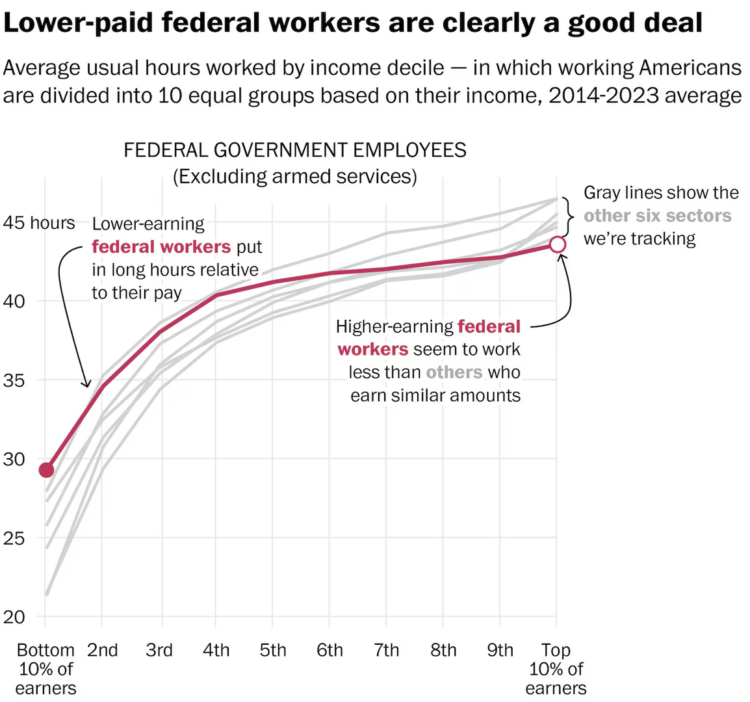
Some might have you believe that federal employees don’t put in the work. For the Washington Post’s Department of Data, Andrew Van Dam shows data that suggests otherwise.
In case you’re unfamiliar with the WP column, Van Dam (usually) attempts to answer a question each week using data. I like how he takes the reader through the exploratory process of trying to figure things out. Most of the time, you can’t answer data questions directly, because there isn’t a direct metric for say, worker efforts. So you analyze the data that is available, build related insights, and see if that gets you to where you need to go.
-
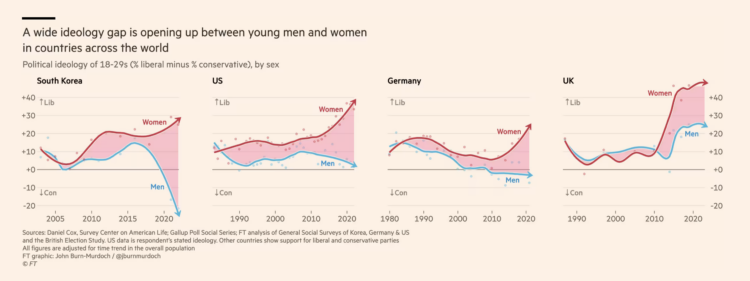
For Financial Times, John Burn-Murdoch shows the gap between men and women in political ideology with a set of difference charts (paywalled). It was typical for people in the same age cohort to follow similar politics, regardless of sex, because they lived similar experiences. But a split appears over the past decade with women leaning more liberal and men leaning more conservative.
I wonder if this internet thing had anything to do with the change.
-
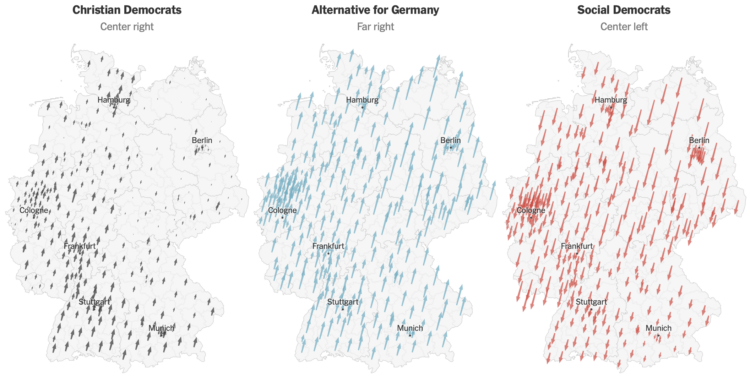
German voters shifted away from the left in their general election this past Sunday. Christian Democrats (center right) won the most seats and Alternative for Germany (far right) came in second. The New York Times has maps and charts that show the change.
Here in the U.S., I couldn’t tell you exactly how elections run elsewhere, so I appreciated the details NYT provides alongside the results.
-
In 1766, Moses Harris published The Natural System of Colours to demonstrate that one could create the full spectrum of colors by combining three primitives: red, yellow, and blue. As a design exercise, Nicholas Rougeux recreated the color wheels using digital tools. The full color palette as hexadecimals is available at the end.
The Library of Congress has scans if you want to check out the original.
-
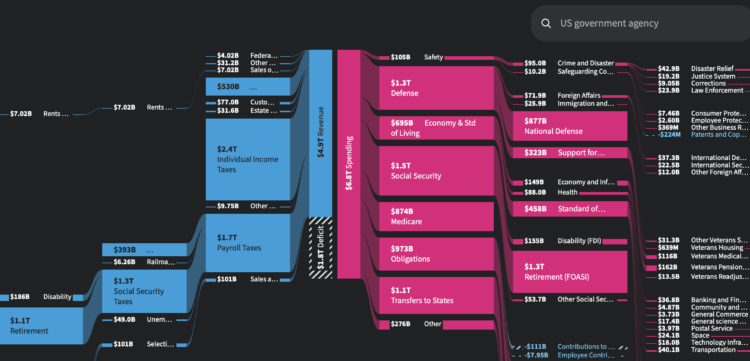
In case you’re wondering about government spending and budgets, USAFacts has a Sankey diagram that shows the money that came in during 2024 and how the revenue was distributed.
According to data from U.S. Treasury Department, $4.9 trillion came in mostly through taxes and $6.8 trillion went out. The difference, $1.8 trillion, contributes to the deficit. It will be interesting to see what this diagram looks like after this year is done (if the data exists).
-
Members Only
-
Marcin Wichary dives deep into the Gorton font, calling it the hardest working font in Manhattan.
The history of this strange font spans over a century and I’ve seen it in so many countries by now, used in so many situations. But it’s impossible for me to say Gorton is the most hard-working font in the world.
To this title, there are many contenders. Garamond has a head start of 300+ years and has been released in more versions than letters in any alphabet. Helvetica is so famous and used so much that even its ugly copy, Arial, became a household name. Whatever font MS Office or a popular operating system appoint to be “the default” – from Times New Roman through Calibri to Roboto – immediately enjoys the world premiere that any Hollywood movie would be envious of. There is even a 5×7 pixel font originally started by Hitachi that you can see everywhere on cheap electronic displays in cash registers and intercoms.
But there is one place in the world where Gorton pulls triple duty, and I feel confident in saying at least this: Gorton is the hardest working font in Manhattan.
There are many pictures and diagrams, but my favorite part are the interactive bits that let you type letters to see and compare characters.
-
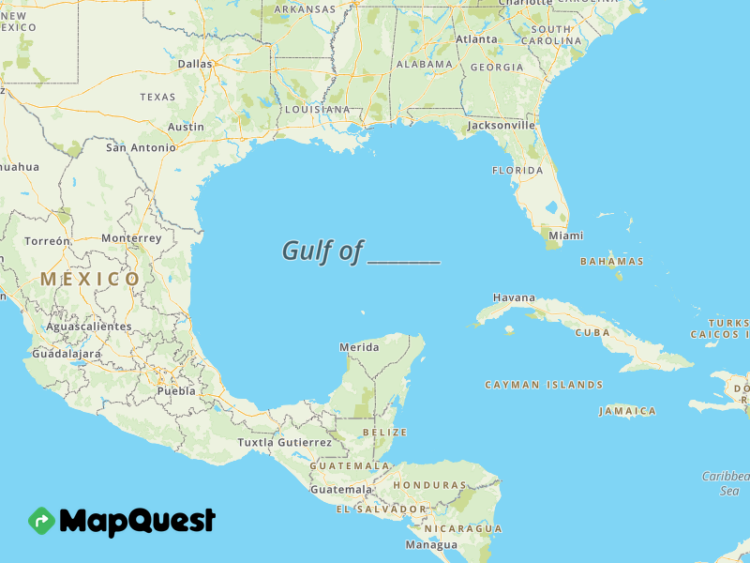
Most of the major map providers changed the name. MapQuest had a different idea. Enter whatever you want and download. (Their standard map still reads the Gulf of Mexico.)
-
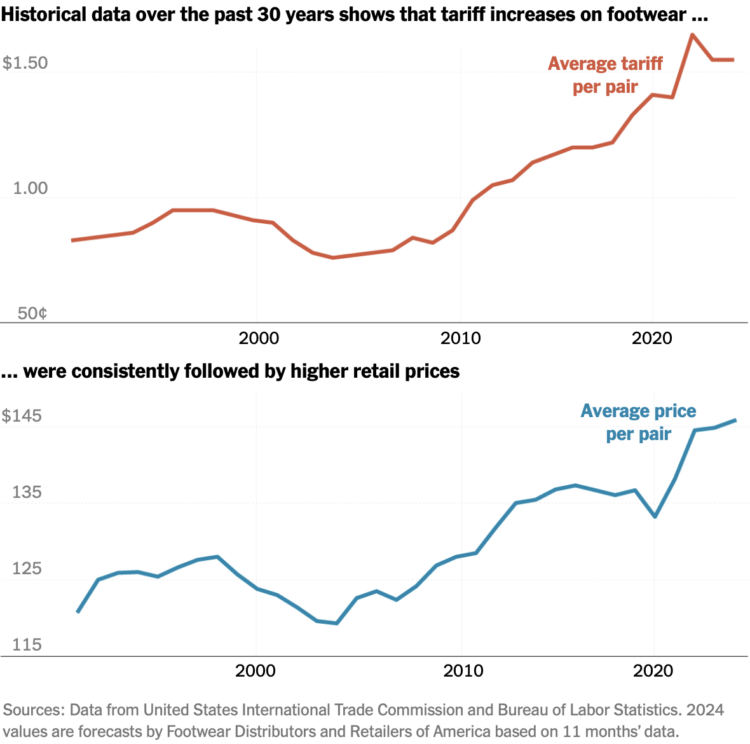
I think I’ve read about tariffs more in the past month than I have my entire life. They’ve been pitched as a cure-all to make countries give into U.S. demands. As you might expect, the effects are not so straightforward or predictable. For The New York Times, June Kim describes various scenarios with a shoe example, as most shoes bought in the U.S. are made elsewhere.
-
The DOGE site has a “wall of receipts” that claims $55 billion in federal government savings. However, as noted by NYT’s the Upshot, a large line item, since removed, showed a contract for $8 billion (with a ‘b’) that should’ve been $8 million (with an ‘m’):
Almost half of those line-item savings could be attributed to a single $8 billion contract for the Immigration and Customs Enforcement agency. But it appears that the DOGE list vastly overstated the actual intended value of that contract. A closer scrutiny of a federal database shows that a recent version of the contract was for $8 million, not $8 billion. A larger total savings number published on the site, $55 billion, lacked specific documentation.
Everyone makes mistakes, but it seems out of bounds when coupled with firings, takedowns, budget cuts, and all the other stuff.
-
Heatmaps and Defining Color Scales
With color as the visual encoding, choose the scales that allow you to see actual patterns.
-
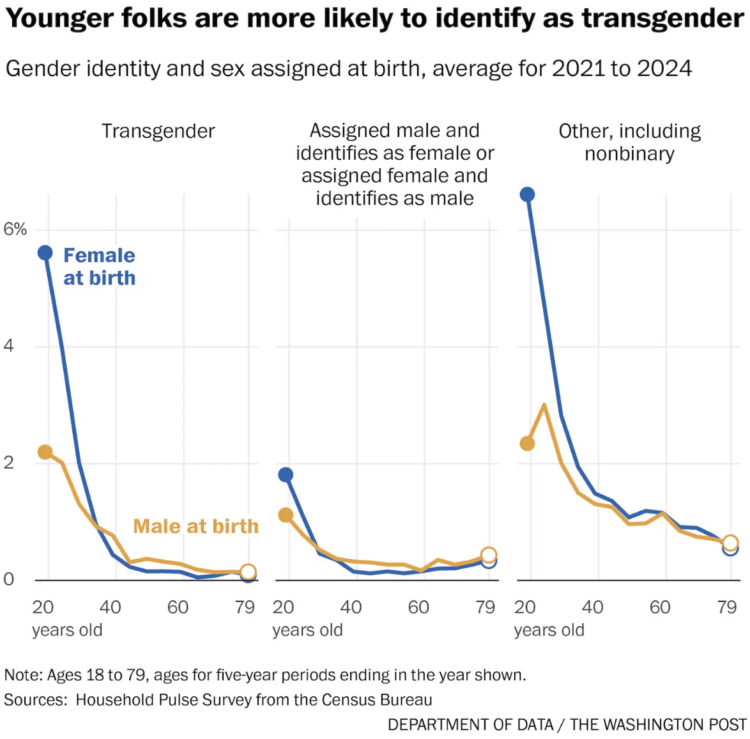
The administration continues its takedown of data that it doesn’t agree with. To get ahead of the wave, if by just a little, Andrew Van Dam for Washington Post’s Department of Data charted datasets that might disappear soon.
-
The Department of Government Efficiency claims data in the Social Security Administration database shows 150-year-olds receiving benefits. Probably not. For Wired, David Gilbert reports:
Because COBOL does not have a date type, some implementations rely instead on a system whereby all dates are coded to a reference point. The most commonly used is May 20, 1875, as this was the date of an international standards-setting conference held in Paris, known as the “Convention du Mètre.”
These systems default to the reference point when a birth date is missing or incomplete, meaning all of those entries in 2025 would show an age of 150.
That’s just one possible explanation for what DOGE allegedly found. Musk could also have simply looked up the SSA’s own website, which explains that since September 2015 the agency has automatically stopped benefit payments when anyone reaches the age of 115.
Is it feigned ignorance? It’s hard to believe that someone with Musk’s status would take data at face value.
-
Coming up on 50 years old, Gina Trapani mapped out her life so far in one-week segments. Colors indicate decades and significant moments in time get text. The timeline is at 49 years old and goes up to 100.
This is great. It’s a way to remember and a way to look forward.
-
Robert Santos, who resigned last month, wrote a heartfelt open letter to Census Bureau workers:
Now, a transition of administrations has occurred as part of our republic’s democratic process. Uncertainty and stress abound. Events are unfolding rapidly. Families are suffering. As a nascent former director, please know that I feel your pain. And in all honestly, stormy weather lies ahead. Yet, the Census Bureau’s mission remains as a beacon of hope.
During my service, I saw that the Bureau’s career staff benefit from four sources of strength. First is your intense dedication to mission. You are leaders in providing quality statistical data about our nation’s people and economy and do this exceptionally well. Each staff person makes their unique contribution towards the mission. Our country needs that more than ever. Second are the Bureau’s organizational values of scientific integrity, objectivity, transparency and independence. These are powerful tools to guide decision making. Third is your profound resilience. You demonstrated to the world that a quality decennial census could be conducted in the midst of a deadly global pandemic. That resilience remains with you, and you’ll again need to draw upon it. Lastly, you have each other. The bonds of colleagueship run deep at the Bureau and are a great source of strength. Beyond these, please understand that there are many, many communities of external stakeholders (me included) who actively advocate for you and the federal statistical community. Stakeholders represent a robust source of strength, and I pray they provide a measure of comfort in these challenging times.








 Visualize This: The FlowingData Guide to Design, Visualization, and Statistics (2nd Edition)


