How Cause of Death Shifted with Age and Time in America
As we get older, our life expectancy declines. But when and how quickly the decline happens and how it happens has changed over the years.
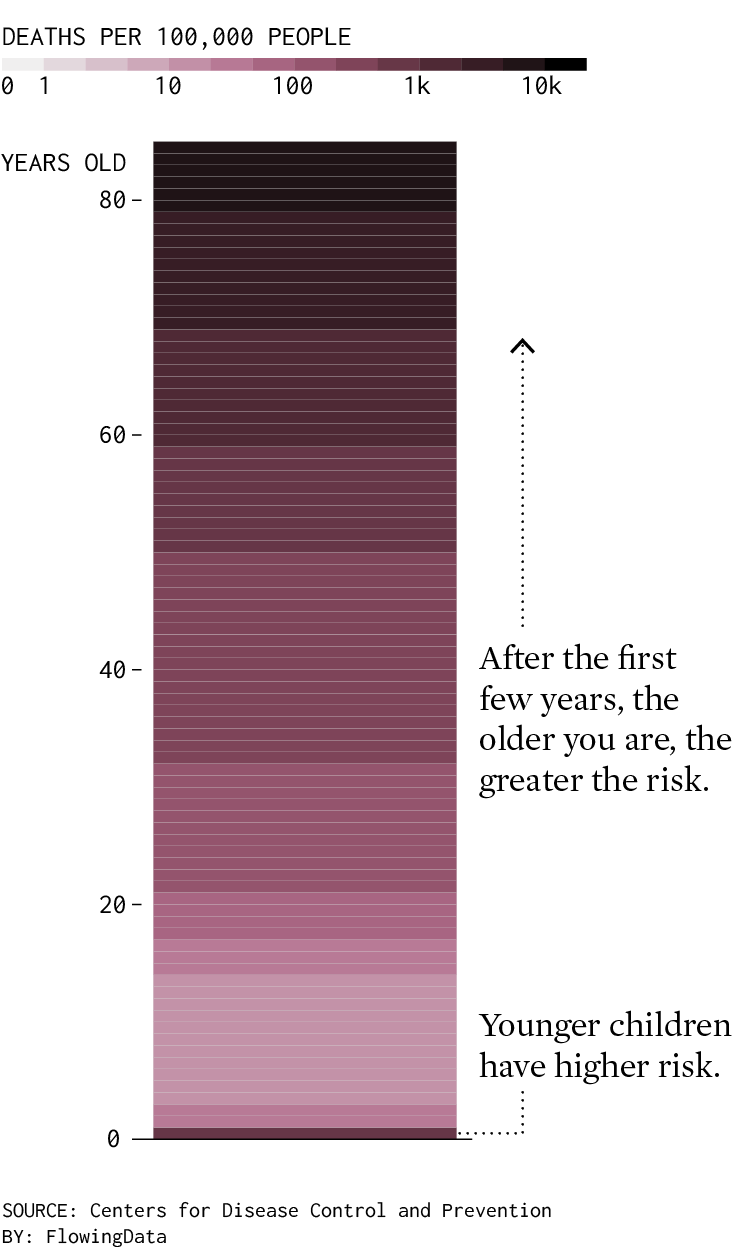
Mortality Rate in 2021, by Age
Here’s what mortality looked like in 2021 for people aged 84 and younger, based on data from the Centers for Disease Control and Prevention (CDC). Darker shades mean higher mortality rate.
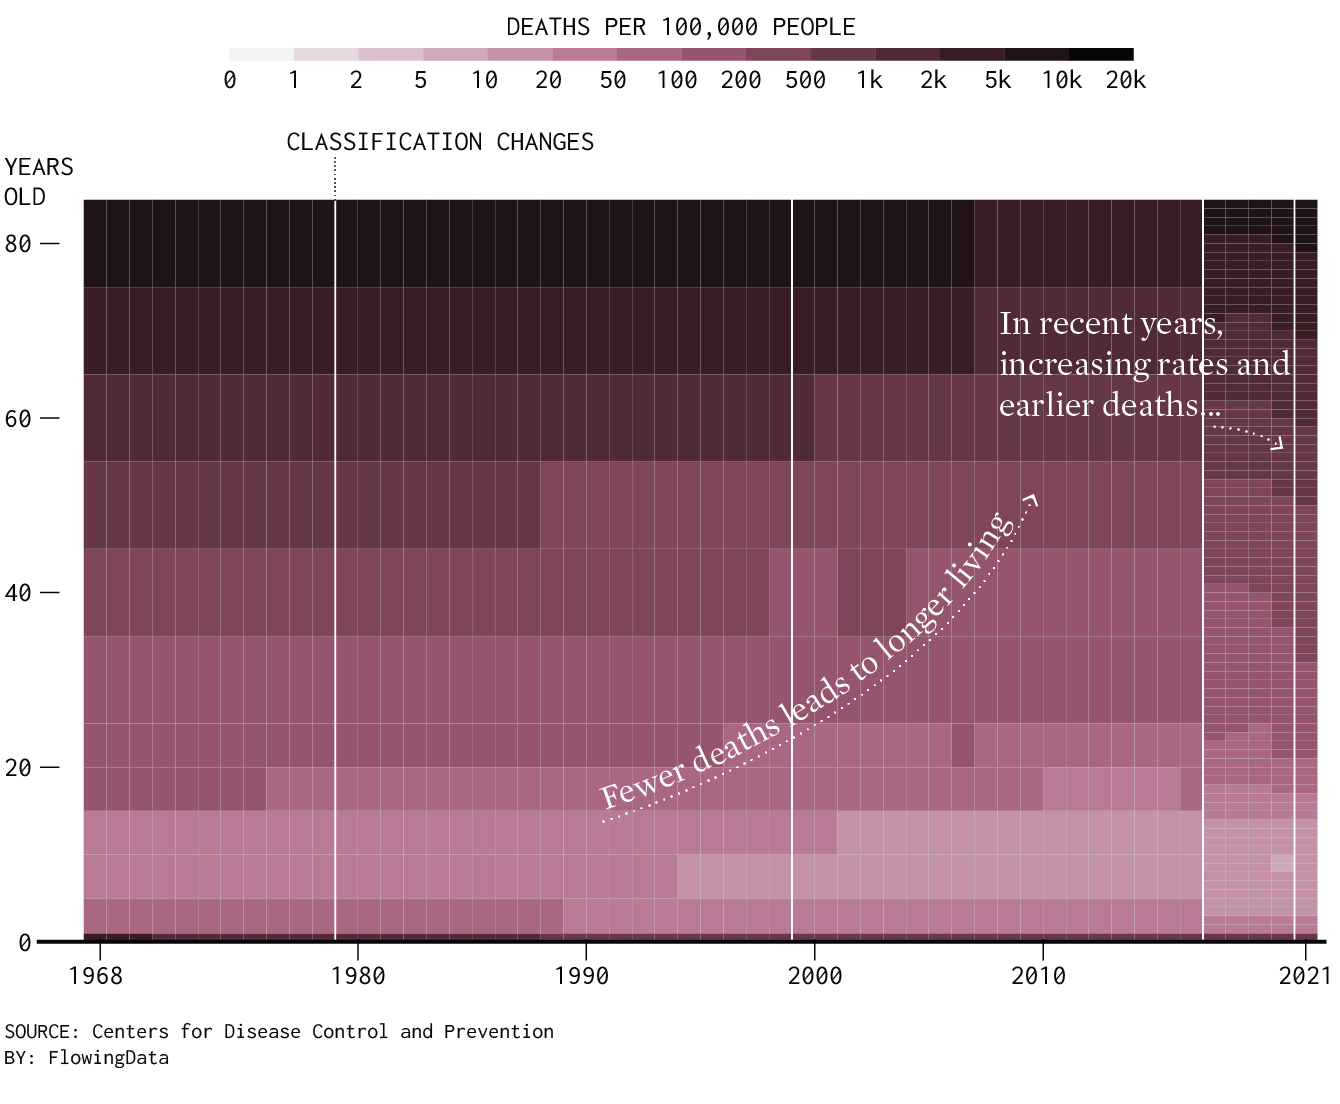
How has this changed over the years? The CDC data goes back to 1968, so we can compare.
However, there have been changes to how causes of death are classified and grouped. The above uses one-year groups for age, but this a more recent thing. In previous years, the data only comes in ten- and five-year groupings. The chart below reflects the data collection changes, but we can still see a clear pattern.
Living Longer, Mostly
Overall mortality decreased over the past decades but seems to have reversed course over the last few years.
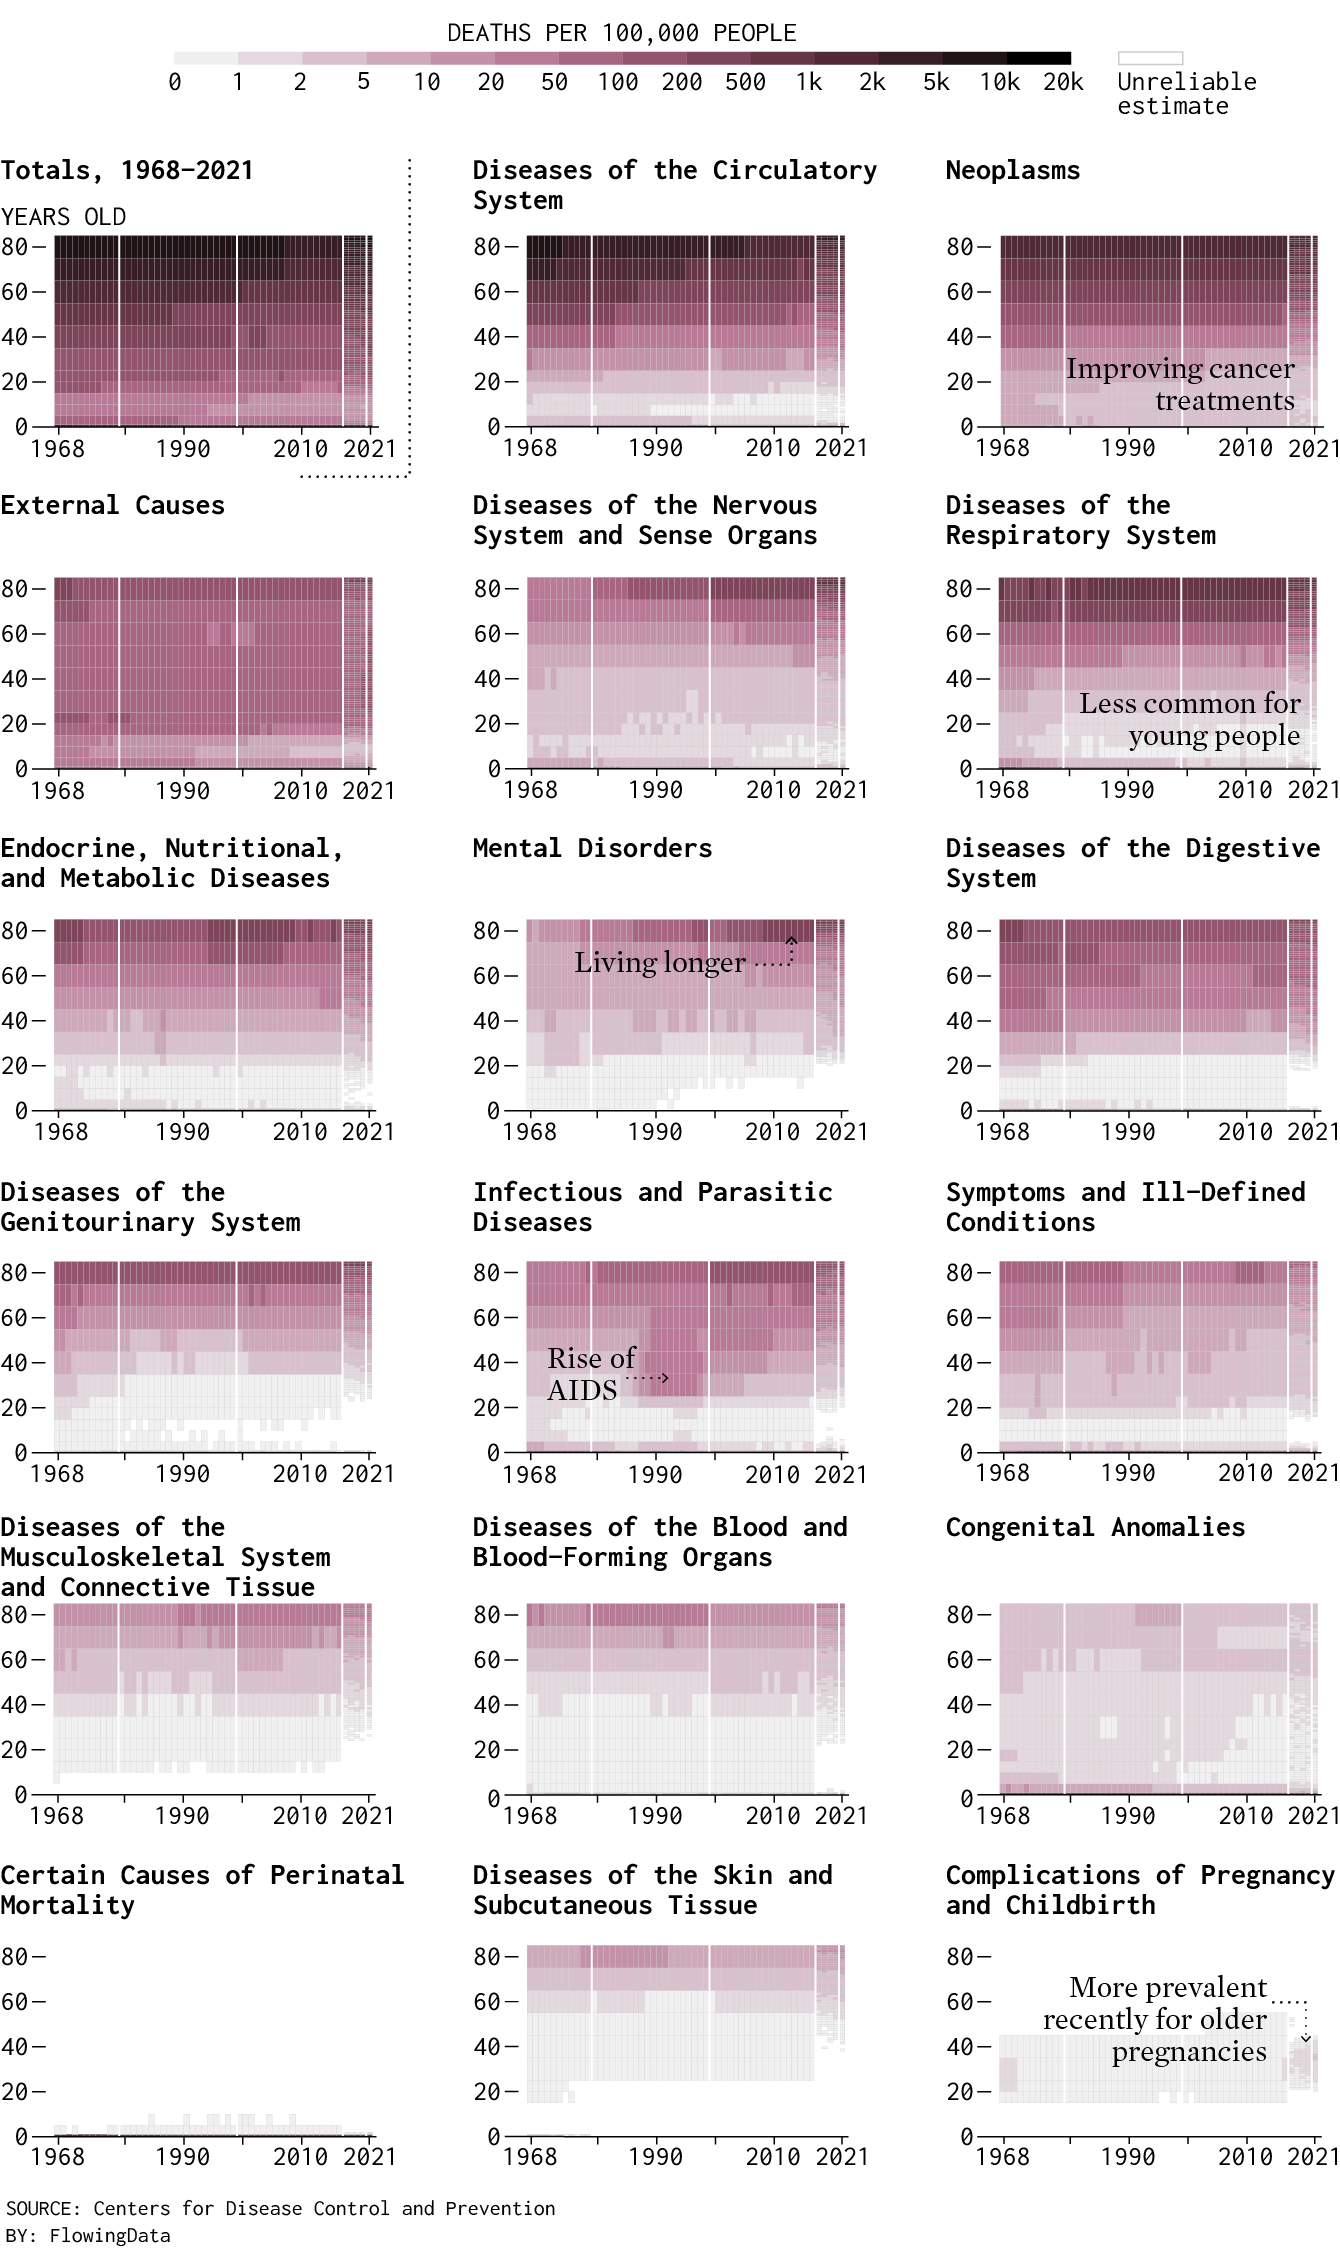
The trends are different depending on the cause of death. The charts below show the same time-age grid for different causes. You can see improving cancer treatments, fewer congenital anomalies, and complications from pregnancies at older ages.
Shifting Causes of Death
Together, a history of mortality in the United States.
Notes
This was motivated by Saloni Dattani’s charts on mortality rates for France from 1925 to 1999. The CDC updates how they count deaths every couple of decades, which made the charts above a little tricky, but the resulting patterns seem to make sense.
Become a member. Support an independent site. Make great charts.
See What You GetFlowingData is made possible by supporting members. Since 2007, I, Nathan Yau, a real person, have been analyzing and visualizing data to help more people understand and appreciate it in their everyday lives.
If you liked this or want to make similar data things, please consider supporting this small corner of the internet. You get unlimited access to visualization courses, tutorials, and extra resources. Thanks. — Nathan
Chart Type Used
