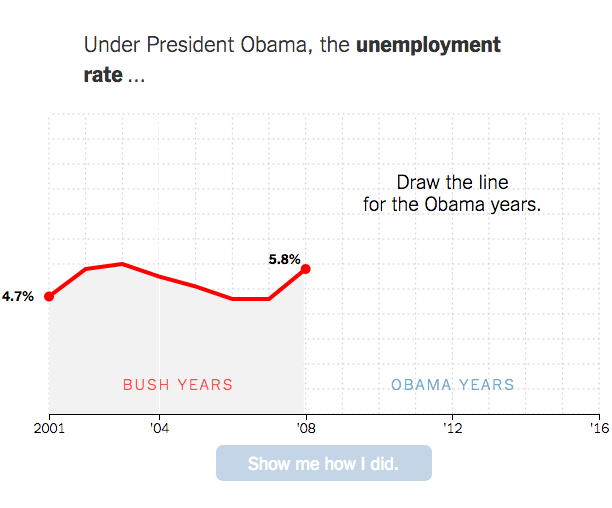
A couple of years back The New York Times asked readers to draw on a blank plot the relationship between income and college attendance. It was a way to get you to think about your own preconceptions and compare them against reality. The Times recently applied the same mechanic to the changes during Barack Obama’s presidency.
Bonus: Here’s how to make your own you-draw-it graph.


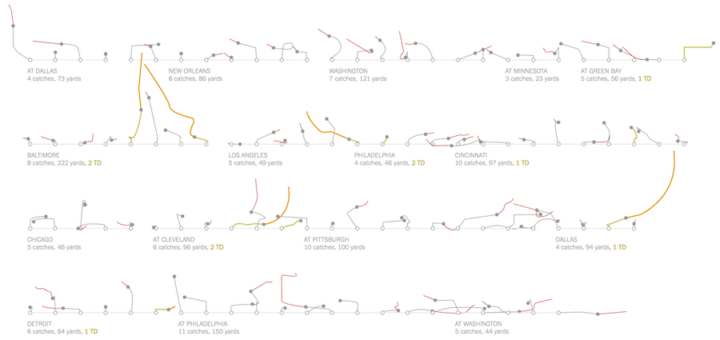
 We tend to think of demographics on a large scale. Countries, counties, and cities. Then we look at trends over time for thousands or millions of people. But it can be equally, if not more, interesting to look at the same trends at a personal level. This is what Dorothy Gambrell did.
 Visualize This: The FlowingData Guide to Design, Visualization, and Statistics (2nd Edition)


