Alcohol consumption, based on ethanol volume estimates, has been rising over the past…
Maps
Intuitive to look at spatial patterns and great for distributing geographic data.
-
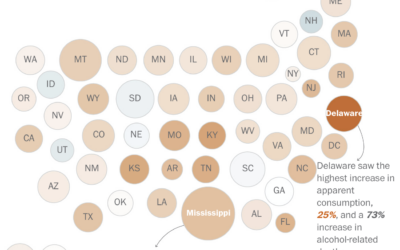
Increasing alcohol-related deaths
-
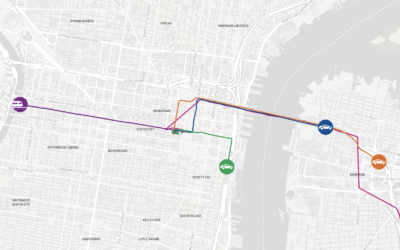
A race to find the best route to the Jersey Shore
To find the fastest route from Philadelphia to the Jersey Shore, The Philadelphia…
-
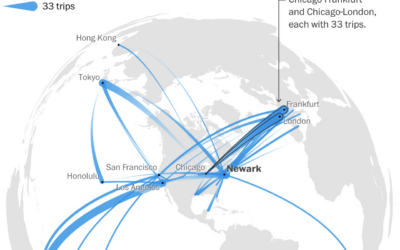
A year of flight paths, for someone with an unlimited pass
United Airlines sold a lifetime unlimited pass in 1990 for $290,000. Tom Stuker…
-
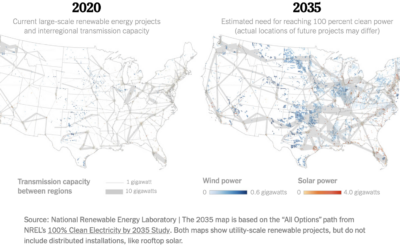
Map of electric grid required for cleaner energy
To power the United States with more clean energy, you might think it’s…
-
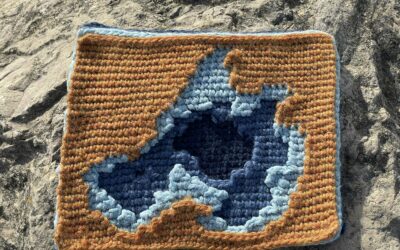
Crochet lake map
Andrew Hahn crocheted a map of Lake Mendota in Wisconsin. Each stitch represents…
-
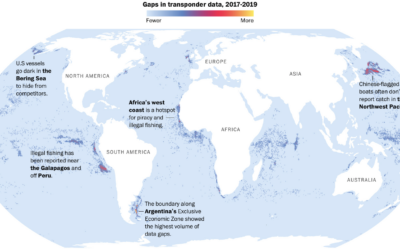
Using gaps in location data to track illegal fishing
Speaking of non-location in the seas, researchers at the University of California at…
-
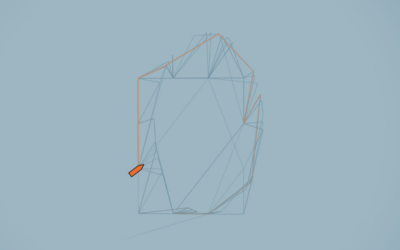
Fake location signals from oil tankers avoiding oversight
The New York Times tracked oil tankers faking their location as they ignore…
-
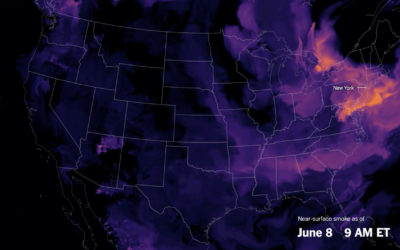
Smoke from Canada wildfires over the U.S.
Wildfires in one area means smoke and pollution travels to surrounding areas, even…
-
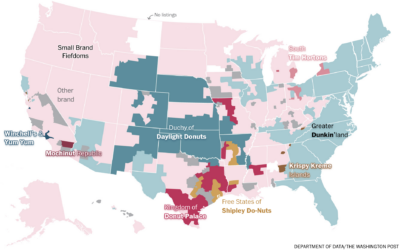
Map of donut federations
In a fun one by Alyssa Fowers, for The Washington Post’s Department of…
-
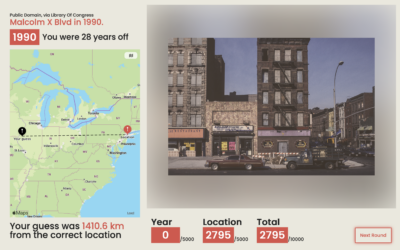
A guessing game for place and time
Add another geolocation guessing game that I am terrible at. TimeGuessr shows you…
-
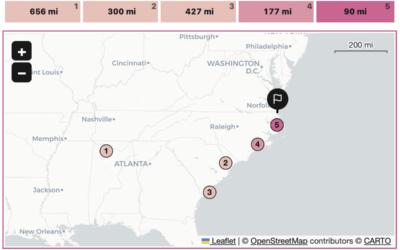
A geolocation game in the format of Wordle
With a cross between the games Wordle and GeoGuessr, Russell Samora for The…
-
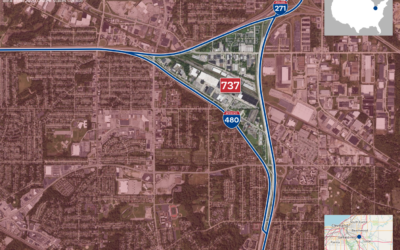
Population surrounded by interstate highways
Filed under random but fun calculations, Alasdair Rae estimated the number of people…
-
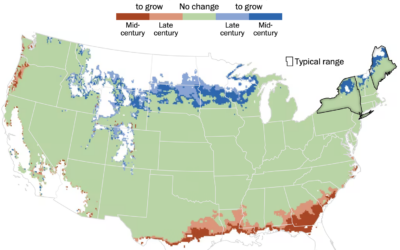
Mapping where trees will grow
As the climate changes, the places that different types of trees will grow…
-
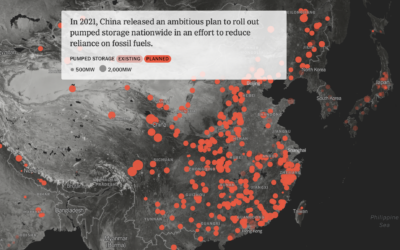
When you cross hydropower and a battery
Mira Rojanasakul and Max Bearak for The New York Times highlight the rise…
-
Melting ice, global effects
Ice is melting at the poles, which makes it seem like a localized…
-
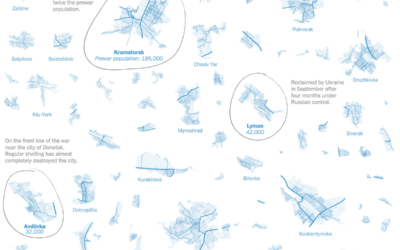
Areas still controlled by Ukraine
For The New York Times, Josh Holder and Marco Hernandez show the areas…
-
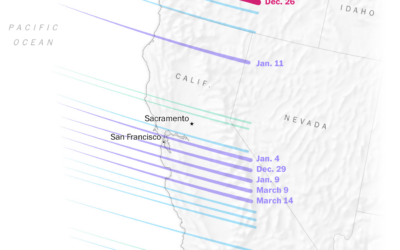
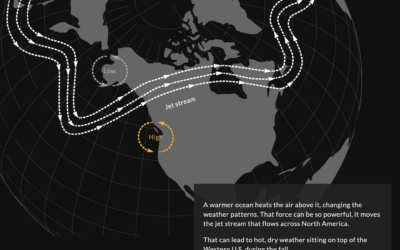
Science behind California rains
It rained a lot more than usual this winter in California. Diana Leonard…
-
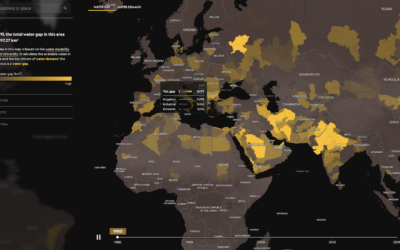
World water gap
We tend to use more water than is available in the world, which…
Recently for Members
Second Edition
 Visualize This: The FlowingData Guide to Design, Visualization, and Statistics (2nd Edition)
 Visualize This: The FlowingData Guide to Design, Visualization, and Statistics (2nd Edition)
New tools, refined process.
Browse by Chart Type See All →


