Generative music comes from the design of a system that produces notes that…
Nathan Yau
-

How generative music works
-
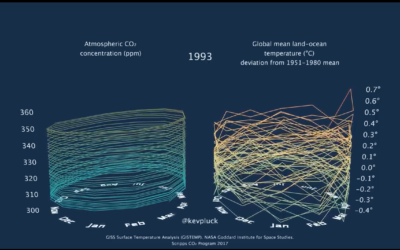
3-D tube chart of global CO2 concentration and temperature
Because you can never have enough time series charts that show increases of…
-

Looking for patterns and structures from the sky
Photographer Bernhard Lang takes pictures in small planes and helicopters, pointing his camera…
-
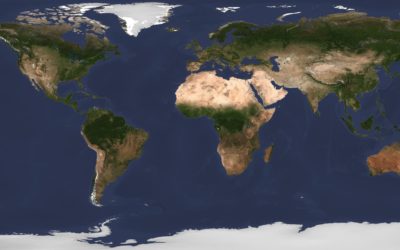
A daily high-resolution image of Earth
Planet monitors Earth with hundreds of satellites, and after six years, they’ve built…
-
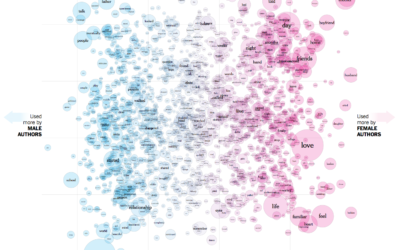
The words used by men and women to write about love
Josh Katz, Claire Cain Miller, and Kathleen A. Flynn for The Upshot plotted…
-
Importance of form and survey design to gain an accurate picture
Lena Groeger, writing for Source, shifts attention upstream from analysis to the design…
-
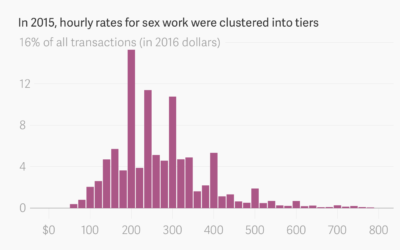
Changing internet markets for sex work
The internet changed how sex workers and clients find each other and how…
-
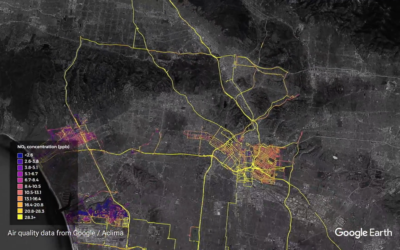
Google maps street-level air quality using Street View cars with sensors
Google equipped their Street View cars with air quality sensors and sent them…
-
Members Only
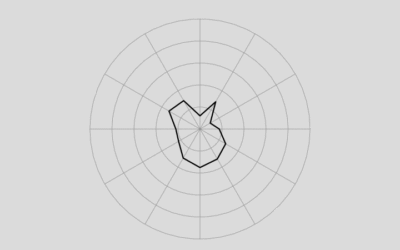
How to Make (and Animate) a Circular Time Series Plot in R
Also known as a polar plot, it is usually not the better option over a standard line chart, but in select cases the method can be useful to show cyclical patterns.
-
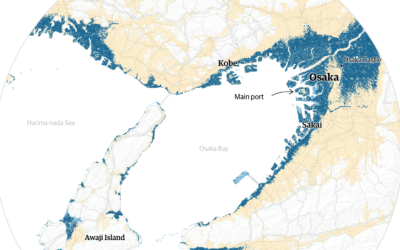
Cities projected to be under water by 2100
Using Climate Central sea-level rise estimates, The Guardian plots and maps the potential…
-
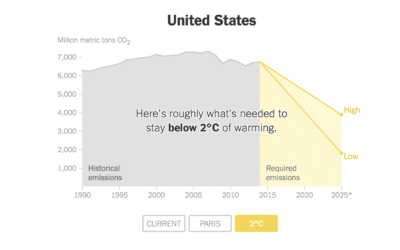
Carbon emissions goals vs. current paths
Brad Plumer and Nadja Popovich reporting for The New York Times:
Under the… -
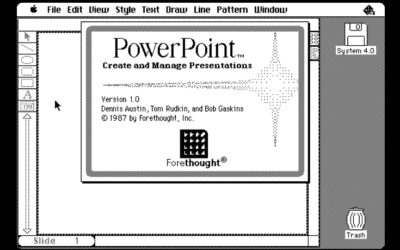
PowerPoint history lesson
David C. Brock writing for IEEE Spectrum delves into the origins of PowerPoint.…
-

Visualization song release
Ukranian band Obiymy Doschu released a new song Razom. “It’s a uplifting and…
-
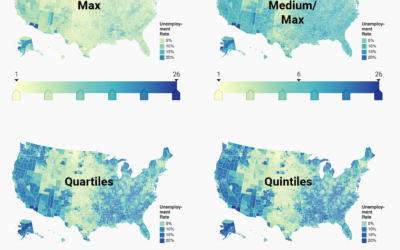
Choosing color palettes for choropleth maps
Choropleth maps, the ones where regions are filled with colors based on data,…
-
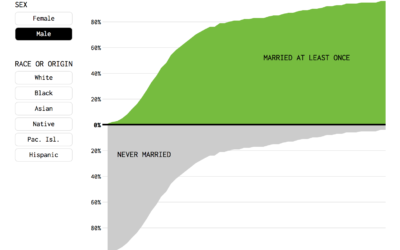
Percentage of People Who Married, Given Your Age
Or, given your age, the percentage of fish left in the sea. Here’s a chart.
-

AI-generated celebrity faces look real
Researchers from NVIDIA published work with artificial intelligence algorithms, or more specifically, generative…
-
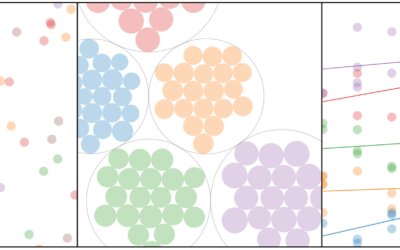
Visual explainer for hierarchical modeling
Hierarchical models, or multilevel models, are used to represent data that might vary…
-
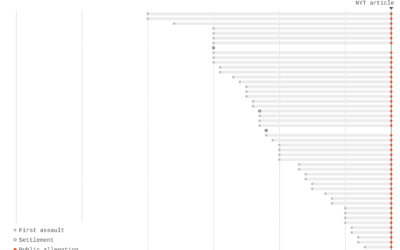
Charts show time between assaults and public allegations
As the list of sexual assault allegations grows for Harvey Weinstein (and many…
-
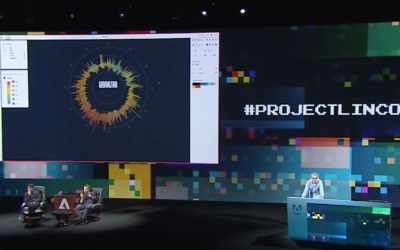
Project Lincoln from Adobe aims to reverse data visualization workflow
With data visualization, you start with the data and let it guide geometry,…
-
Data journalism lessons available from ProPublica Data Institute
ProPublica runs a small annual workshop to teach journalists a bit about data…
Recently for Members
Second Edition
 Visualize This: The FlowingData Guide to Design, Visualization, and Statistics (2nd Edition)
 Visualize This: The FlowingData Guide to Design, Visualization, and Statistics (2nd Edition)
New tools, refined process.
Browse by Chart Type See All →


