How to Visualize Proportions in R

There are many ways to show parts of a whole. Here are quick one-liners for the more common ones.
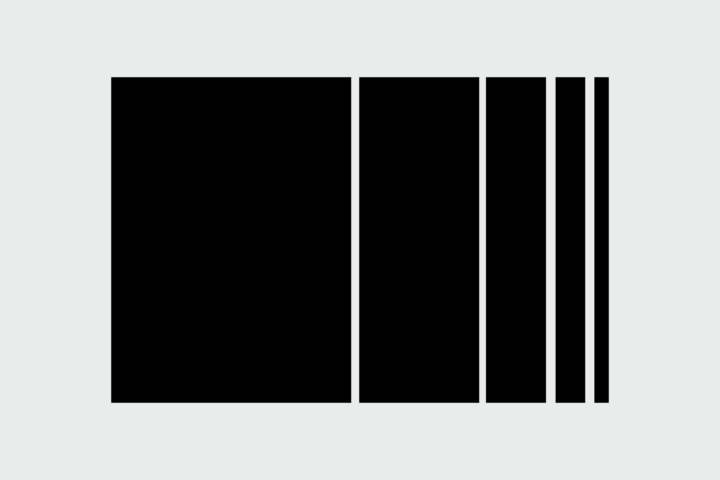
You can visualize proportions in a lot of ways. However, there are visualization types that are commonly used, which typically means they’re more commonly understood by a lot of people.

In this tutorial, we quickly go through what you can use in R, focusing on the types that maintain the parts-of-a-whole metaphor. I won’t harp on whether a method is useful or not. Instead, I’ll give you the tools, and you can decide what you want to do with it.

Before Getting Started

This is an R tutorial, so you should have R installed to work through the examples. Here’s a short guide here if you don’t have it yet.

You also need some data. With the R console open, enter the below for some numbers to work with.

# Some data
pct <- c(10, 20, 30, 40)
shades <- c("white", "lightgray", "darkgray", "black")
categories <- c("a", "b", "c", "d")

And that’s it. You use one package, but you can install that when the example comes.

Pie Chart

How can you not start with this one? Base R provides pie() to make everyone’s favorite proportional chart. Pass a vector of values, and the function does the rest. If you pass raw counts, the function does the math for percentages. Optionally, you can specify label names with the labels parameter and color with col. The order of these vectors should correspond to the values vector.

pie(pct, labels = categories, col = shades)

As expected, here’s your pie chart in all its circular glory.

Pie

Donut Chart

R doesn’t provide a donut chart function out of the box, but you can quickly make one by modifying a pie chart. Just slap a circle in the middle using symbols().

pie(pct, labels = categories, col = shades)
symbols(0, 0, circles = 1, add=TRUE, bg="white")

The first line with pie() is the same as the previous example. As for symbols(), you pass the x- and y-coordinate, which is (0, 0) in this case, set the circle radius to 1, add to the existing pie, and set the color to white.

Donut?

02-donut

homer-donut

Sorry, I couldn’t resist.

Square Pie Chart

We covered these in a previous tutorial. Again, there’s no function from base R, but we can use the custom function from said tutorial for a squarePie() function.

To change your working directory: In RStudio, go to the Session → Set Working Directory menu. In standard R, go to Misc → Change Working Directory.Before you use source() to load square-pie-chart.R, make sure your current working directory in R is set to where you downloaded this tutorial’s code.

The squarePie() function takes a vector of values and a corresponding vector of colors.

source("lib/square-pie-chart.R")
squarePie(pct, col = shades, main="")

Square:

03-square-pie

For more on square pie charts, check out the tutorial.

Area Graph

The area graph can be useful to show proportions over time. Like the square pie chart, we covered these in a previous tutorial, and the end result was a function we can reuse.

First, load the code with source(). Again, your working directory must be set to this tutorial’s download folder.

source("lib/areagraph.R")

Then we create a data frame where each row represents a layer of the area graph. Each column represents a segment of time.

pct_over_time <- rbind(pct1=pct, pct2=2*pct)
pct_df <- data.frame(pct_over_time)

Plug the data frame into areaGraph().

areaGraph(pct_df, type=0)

Stacked area

Try setting type to 1 or 2 for different baseline offsets.

For more on area charts, check out the tutorial.

Stacked Bar Chart

You can view the contents of any data structure in R by entering the variable name. For example, enter “pct_over_time” to see what the matrix looks like.The stacked bar chart is the stacked area chart’s discrete cousin. The barplot() function in R will take care of it for you, but instead of the data frame used with areaGraph(), you provide a matrix.

barplot(pct_over_time)

Stacked bar

Treemap

This one relies on a package, aptly named treemap. Use install.packages() to install, as shown below. Then load the package with library().

install.packages("treemap", dependencies = TRUE)
library(treemap)

The function takes a data frame of values, categories, and colors as its columns. So each row of the data frame represents a value, what color and/or size the rectangle in the treemap should be, and what it should be labeled.

vals <- data.frame(pct=pct, cat=categories, col=shades)

Enter ?treemap to see more options.Pass the newly constructed data frame to treemap(), and then use the column names to specify what makes what. In this example, the index (i.e. the categories) is the “cat” column, the size of the rectangle (vSize parameter) is based on “pct”, color (vColor) is set by “col”, and set type to “color” to specify that colors are already defined.

treemap(vals, index="cat", vSize="pct", vColor="col", type="color")

Treemaps are actually more useful for hierarchical data, but this kind of works too.

Treemap

Wrapping Up

That should cover about 90 percent of your proportion problems easily. Of course, there’s no rule that you must stick to the parts-of-a-whole metaphor. So if you’re willing to get away from that, you can use other stand-bys like a bar chart or a dot plot.

Made possible by FlowingData members.
Become a member to support an independent site and learn to make great charts.

See What You Get

About the Author

Nathan Yau is a statistician who works primarily with visualization. He earned his PhD in statistics from UCLA, is the author of two best-selling books — Data Points and Visualize This — and runs FlowingData. Introvert. Likes food. Likes beer.

2 Comments

  • Michael Stoelzle September 29, 2016 at 3:05 am

    Nice suggestions. I would prefer doing this with ‘dplyr’ and ‘ggplot’, however, worthwhile to mention why a donut chart is much better than a pie chart: In pies we compare angles and this is much harder than comparing line lengths. So, when you decided to make a pie, make a donut, because the segments look more than lines and the angle-problem is little bit solved. By the way, I like the white circle in the donut chart, you can put some information, label etc. into it.
    Best, Michael

Add Comment

You must be logged in and a member to post a comment.