Peter J. Rentfrow, et al. studied personality clusters across states using data from…
-
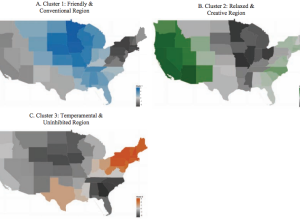
Regional personality
-
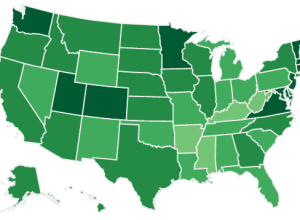
Responsive maps with D3.js
A challenge these days with visualization is that a piece might look great…
-

My data point
It’s been continuous tracking and monitoring for the past couple of days and…
-
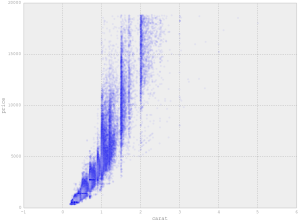
R plotting package ggplot2 ported to Python
Those who use the ggplot2 package in R and do everything else in…
-
Super duper full-featured paper map
Check out this awesome new thing called MAP. It’s made of 100% sustainable…
-
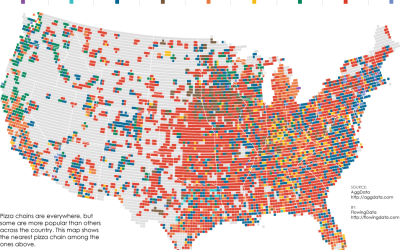
Pizza Place Geography
Most of the major pizza chains are within a 5-mile radius of where…
-
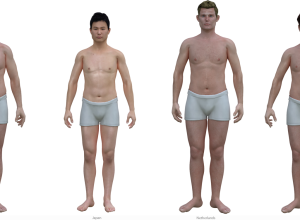
Average man graphic renderings
James Hamblin for The Atlantic rendered the average American man based on BMI…
-

Maritime traffic in the Baltic Sea, animated
Digital artist Lauri Vanhala animated a day of maritime traffic in the Baltic…
-

Map of median home listing prices
In their continued efforts to help potential home buyers find out all they…
-
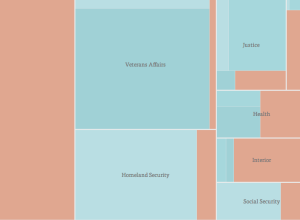
Furloughed employees during shutdown
Dan Delany took a simple look at furloughed employees due to the government…
-
Raw, a tool to turn spreadsheets to vector graphics
Sometimes it can be a challenge to produce data graphics in vector format,…
-
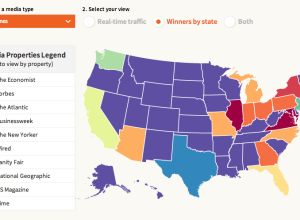
Real-time media consumption
Last year, URL shortening service bitly and Forbes made a map that showed…
-
Data point on the way
I’m at an age where my feed is filled with data points. Every…
-
10 seconds of extreme trading
The video below shows ten seconds of trading on Blackberry on October 2,…
-
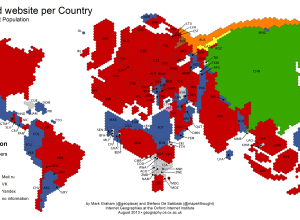
Most visited site by country
Mark Graham and Stefano De Sabbata for Information Geographies mapped the most visited…
-

Government data shutdown
When you go to the United States Census site, Data.gov, or similar government-run…
-
Consequences of big data exclusions
Big data, in all its glory, promises insights into the soul of humankind.…
-
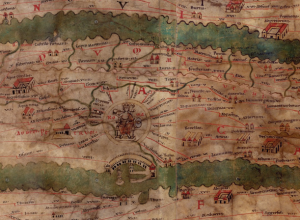
Greco-Roman mapmaking
Measuring and Mapping Space: Geographic Knowledge in Greco-Roman Antiquity opens at Institute for…
-
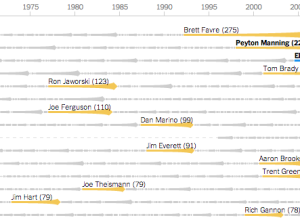
Quarterback streaks →
Mike Bostock, Shan Carter, and Kevin Quealy for The New York Times explore…
-
Cities pulse via Foursquare check-ins
Foursquare check-ins can be self-encapsulated and personal to the individual, where each dot…
Recently for Members
Second Edition
 Visualize This: The FlowingData Guide to Design, Visualization, and Statistics (2nd Edition)
 Visualize This: The FlowingData Guide to Design, Visualization, and Statistics (2nd Edition)
New tools, refined process.
Browse by Chart Type See All →


