• Membership
  • Newsletter
  • Projects
  • Learning
  • About
  • Member Login
  • Passing restrictive voting bills

    June 22, 2021

    Topic

    Infographics  /  bills, government, voting

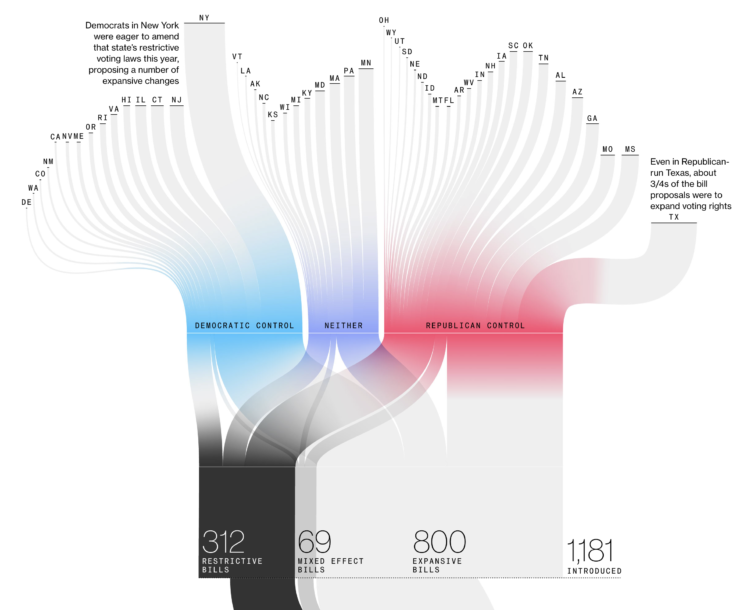
    Bloomberg used a Sankey diagram to show the path of over a thousand voting bills, classifying them as restrictive, mixed effect, or expansive:

    Across the country, Republican state lawmakers proposed more than 300 bills this year to restrict voting and dozens more that would restrict in some ways and expand in others. But the broadest measures either stalled or were scaled back.

  • India vaccine procurement compared to other countries

    June 21, 2021

    Topic

    Statistical Visualization  /  coronavirus, India, Reuters, vaccine

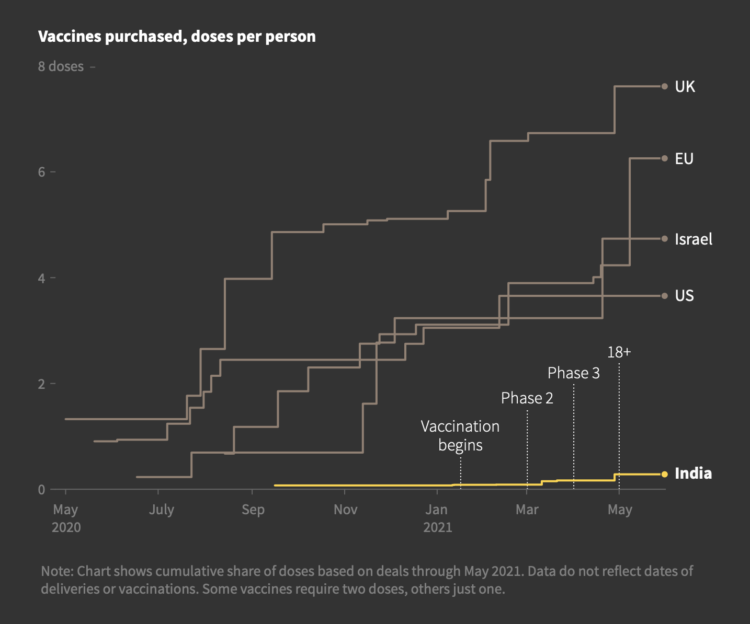
    Prasanta Kumar Dutta and Manas Mishra reporting for Reuters on the slow rollout of Covid-19 vaccinations in India:

    Compared to many Western countries, India was late in procuring vaccines. Modi’s government placed the first advance order for an unapproved vaccine only this month, after being criticised for being slow. Countries including the United States and Britain signed orders last year.

  • Welcome to heat dome

    June 18, 2021

    Topic

    Infographics  /  climate change, heat dome, Washington Post

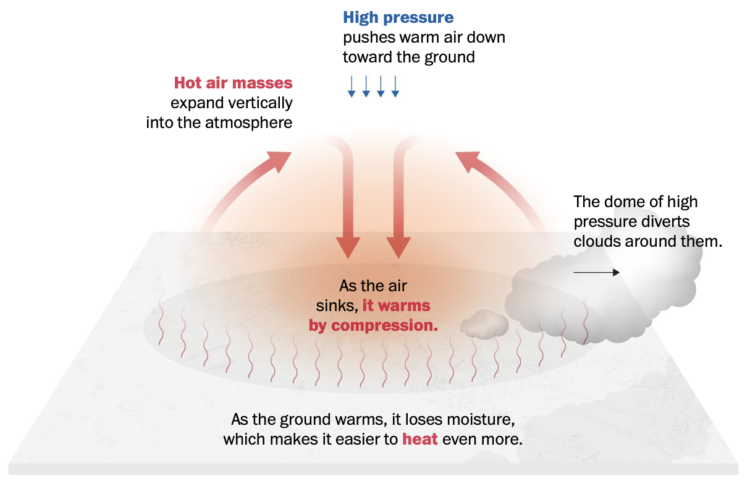
    It’s hot here in the western United States, and it’s only mid-June. From The Washington Post, we’re stuck in a heat dome:

    Hot air masses expand vertically into the atmosphere, creating a dome of high pressure that diverts weather systems around them. One way to gauge the magnitude of a heat wave is to measure the height of the typical halfway point of the atmosphere — at the 500 millibar pressure level. For this pressure level to stretch to heights of 600 dekameters, or 19,685 feet, is quite rare, but that marker was forecast for this week, and it was indeed reached in Flagstaff, Ariz., on Tuesday.

    Splendid.

  • Measuring centuries-old droughts through tree rings

    June 18, 2021

    Topic

    Infographics  /  Alvin Chang, drought, Guardian, tree ring

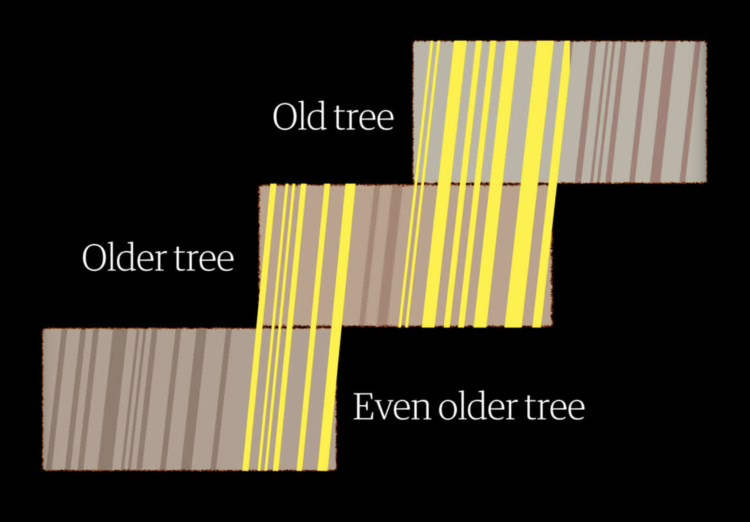
    To measure drought in the present day, we use data from sensors that constantly record environmental conditions, such as soil moisture, precipitation, and snow water content. But to measure drought thousands of years ago, researchers can use tree rings. Alvin Chang for The Guardian shows how the researchers line up old rings to gather historical data and then do that across a region.

  • Graphs before anyone knew what they were

    June 18, 2021

    Topic

    Statistical Visualization  /  book, history, Howard Wainer, Michael Friendly, New Yorker

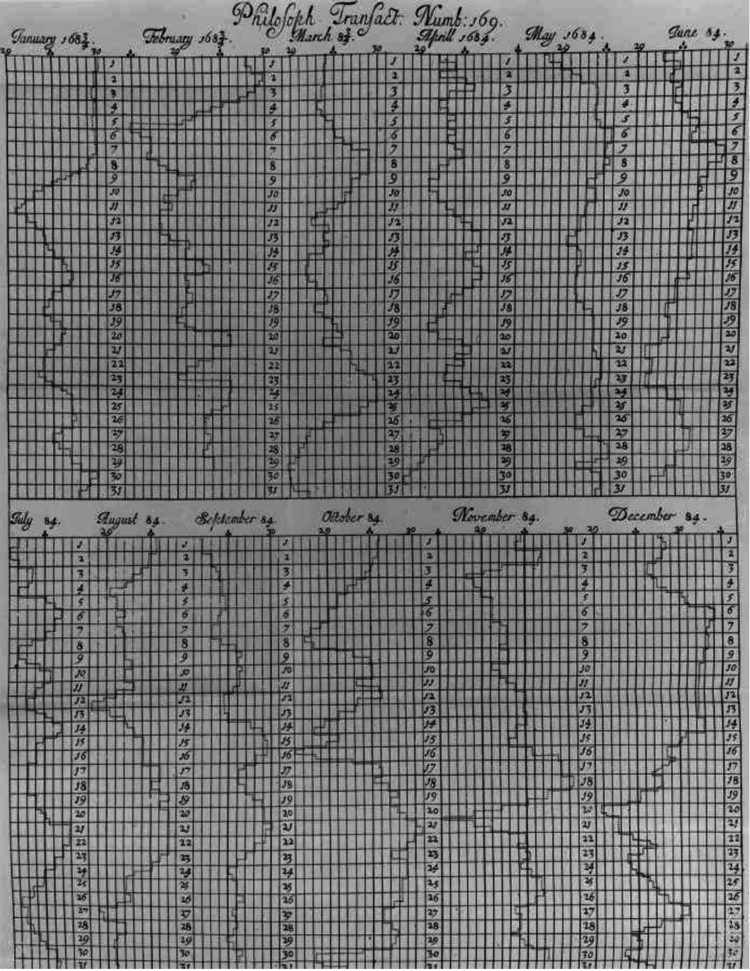
    Michael Friendly and Howard Wainer have a new book out: A History of Data Visualization and Graphic Communication. They rewind back 400 years and discuss the beginnings of visualization, when nobody knew what a chart was. Putting this in my queue and hoping it’s back in stock soon.

    Visualization still seems like a relatively new thing. It’s old.

  • Members Only

    Breaking Down a Chart Design – The Process 144

    June 17, 2021

    Topic

    The Process  /  trade-off, workflow

    This week I broke down one of my projects and explained as many of the design choices as I could.

  • Spatula, a Python library for maintainable web scraping

    June 17, 2021

    Topic

    Software  /  Python, scraping

    This looks promising:

    While it is often easy, and tempting, to write a scraper as a dirty one-off script, spatula makes an attempt to provide an easy framework that most scrapers fit within without additional overhead.

    This reflects the reality that many scraper projects start small but grow quickly, so reaching for a heavyweight tool from the start often does not seem practical.

    The initial overhead imposed by the framework should be as light as possible, providing benefits even for authors that do not wish to use every feature available to them.

    Although, without my dirty one-off scripts, what will I put in my tmp data folder?

  • How to Make Alluvial Diagrams

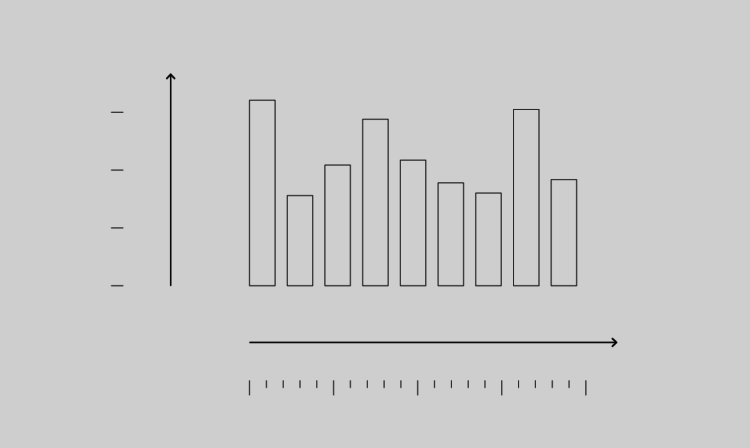
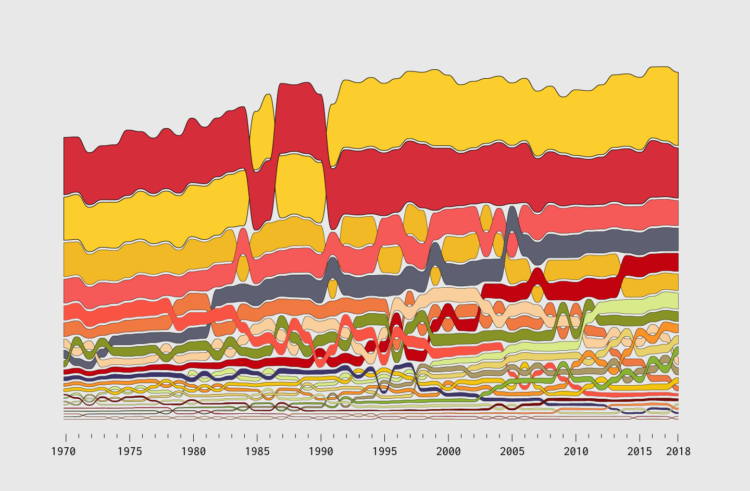
    Here’s how to do it in R from start to finish, plus editing in illustration software. Make design choices and trade-offs for more readable charts.

  • Collapse of Mexico City Metro explained

    June 16, 2021

    Topic

    Infographics  /  crash, metro, New York Times, scrollytelling

    The New York Times investigated the collapse of the Metro, which killed 26 people. They explain their findings with a 3-D model of the train and the tracks:

    The Times took thousands of photographs of the crash site and shared the evidence with several leading engineers who reached the same conclusion: The steel studs that were vital to the strength of the overpass — linchpins of the entire structure — appear to have failed because of bad welds, critical mistakes that likely caused the crash.

    Impressive use of visuals and scrollytelling to take you through the seemingly small mistakes that added to a terrible outcome.

  • xkcd: Base Rate

    June 15, 2021

    Topic

    Infographics  /  baseline, humor, xkcd

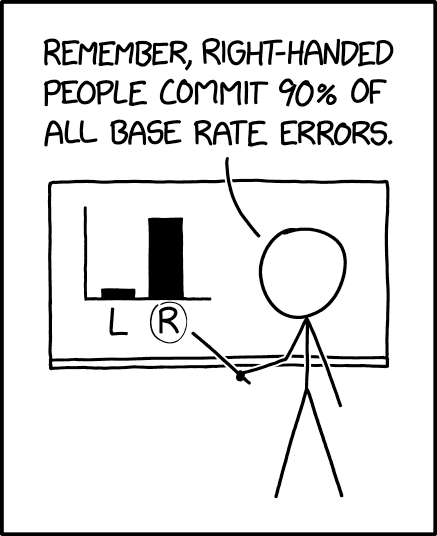
    xkcd points out the importance of considering the baseline when making comparisons:

  • Scale of a mouse plague

    June 14, 2021

    Topic

    Infographics  /  Australia, mouse, plague, scale, Washington Post

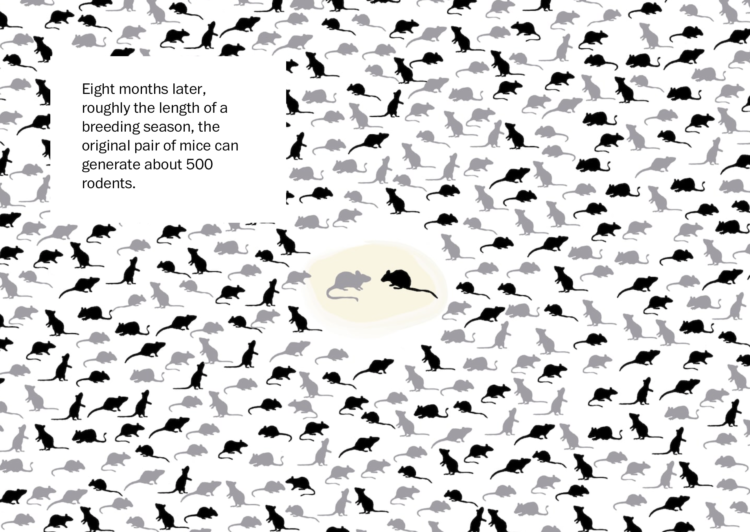
    There’s a mouse plague in Australia right now. The words alone don’t express the scale and seriousness of this problem, but this Washington Post piece sure does. The combination of video, photos, and graphics clearly demonstrates the scale. It starts with a pair of mice and escalates quickly from there — and might give you the willies along the way.

  • Drought in the Western United States

    June 14, 2021

    Topic

    Maps  /  climate change, drought, Nadja Popovich, New York Times

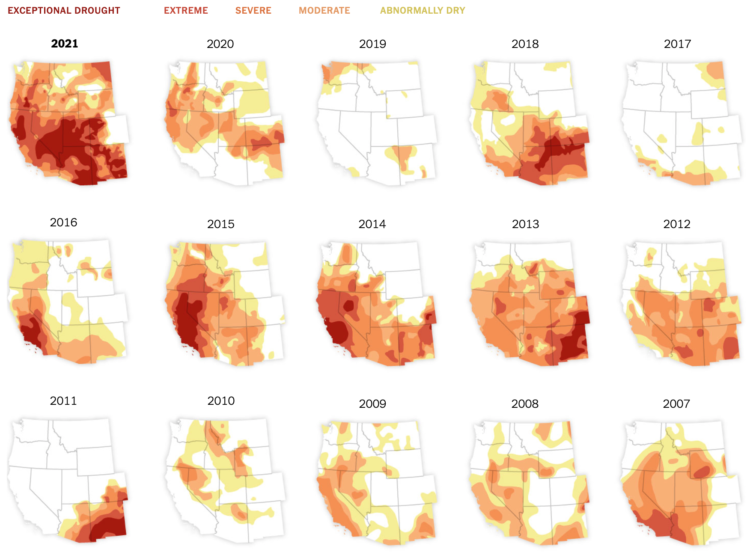
    In what’s become a recurring theme almost every year, the western United States is experiencing drought, much of it exceptional or extreme. Nadja Popovich for The New York Times has the small multiple maps to show June conditions each year since 2000.

  • Tapestry for reflective data visualization

    June 11, 2021

    Topic

    Data Art  /  Catherine Madden, physical, weaving

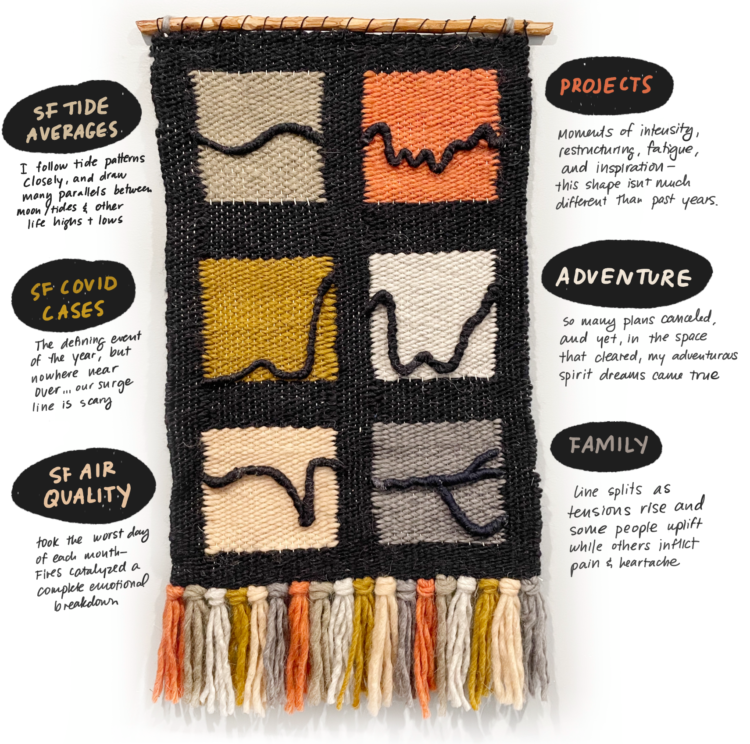
    As a way to reflect on 2020, Catherine Madden wove tapestry to visualize six time series. So nice. [via Visualising Data]

  • Members Only

    Slow – The Process 143

    June 10, 2021

    Topic

    The Process  /  slow

    If you’ve got it, take the time to understand and explore your data in the places others rushed through.

  • All the passes in soccer visualized at once

    June 10, 2021

    Topic

    Statistical Visualization  /  Karim Douïeb, passing, soccer

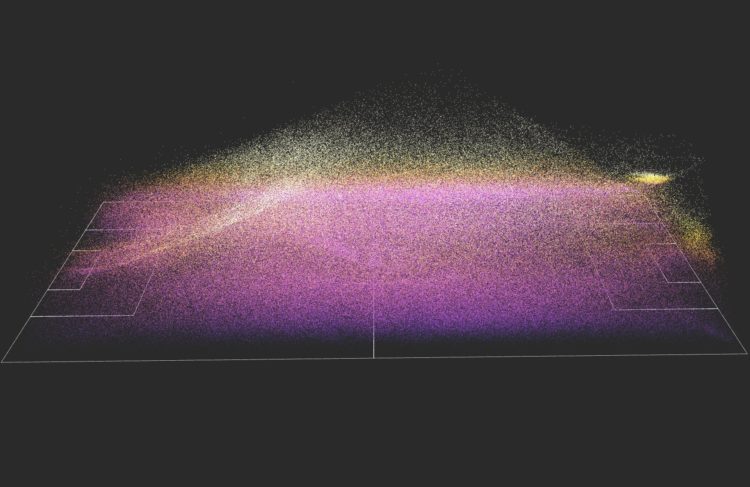
    This is a fun soccer graphic by Karim Douïeb. It shows 882,536 passes from 890 matches across various leagues and seasons. It looks cool as a static point cloud, but be sure to check out the animated, interactive version which lets you isolate the view to specific parts of the field.

    It reminds me of the Windows 3.1 fireworks screensaver. Those were the days.

    You can find the data via StatsBomb, in case you want to play around.

  • Billionaire tax rates

    June 9, 2021

    Topic

    Statistics  /  billionaires, money, ProPublica, taxes

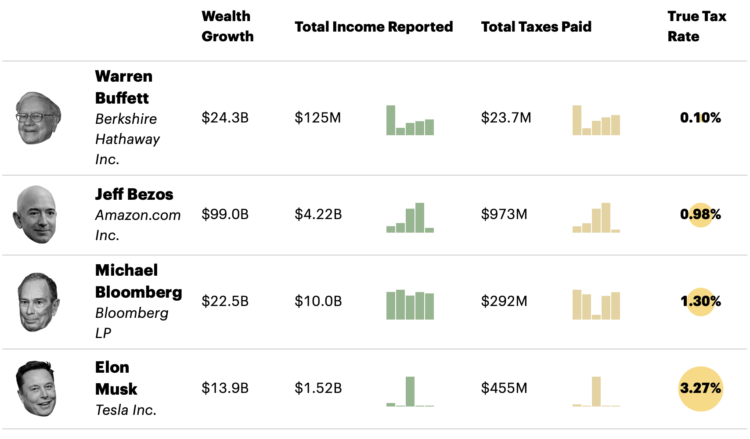
    ProPublica anonymously obtained billionaires’ tax returns. Combining the data with Forbes’ billionaire wealth estimates, ProPublica calculated a “true tax rate” for America’s 25 richest people:

    The results are stark. According to Forbes, those 25 people saw their worth rise a collective $401 billion from 2014 to 2018. They paid a total of $13.6 billion in federal income taxes in those five years, the IRS data shows. That’s a staggering sum, but it amounts to a true tax rate of only 3.4%.

    It’s a completely different picture for middle-class Americans, for example, wage earners in their early 40s who have amassed a typical amount of wealth for people their age. From 2014 to 2018, such households saw their net worth expand by about $65,000 after taxes on average, mostly due to the rise in value of their homes. But because the vast bulk of their earnings were salaries, their tax bills were almost as much, nearly $62,000, over that five-year period.

    As you might guess, a lot of the disparity has to do with wealth held in unrealized capital gains. The other part is how the ultrawealthy still pay for everything when most of their money is in investments and how that factors into deductions.

  • Data Underload  /  diet, food, USDA

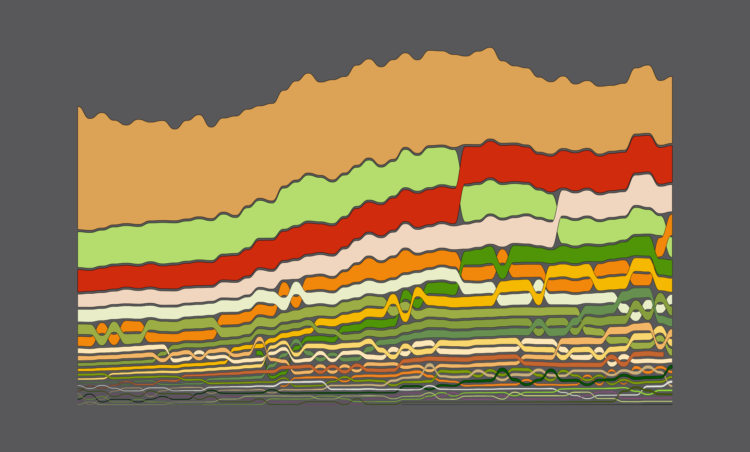
    Seeing How Much We Ate Over the Years

    How long will chicken reign supreme? Who wins between lemon and lime? Is nonfat ice cream really ice cream? Does grapefruit ever make a comeback? Find out in these charts.

    Read More
  • Money-in-politics nonprofits merge their datasets

    June 7, 2021

    Topic

    Data Sources  /  government, money, OpenSecrets, politics

    Center for Responsive Politics and National Institute on Money in Politics are merging their datasets to make it more accessible:

    The nation’s two leading money-in-politics data organizations have joined forces to help Americans hold their leaders accountable at the federal and state levels, they said today.

    The combined organization, OpenSecrets, merges the Center for Responsive Politics (CRP) and the National Institute on Money in Politics (NIMP), each leading entities for three decades. The merger will provide a new one-stop shop for integrated federal, state and local data on campaign finance, lobbying and more, that is both unprecedented and easy to use.

    Good. More important than ever.

  • Rockhounding in California

    June 7, 2021

    Topic

    Infographics  /  Los Angeles Times, rockhounding

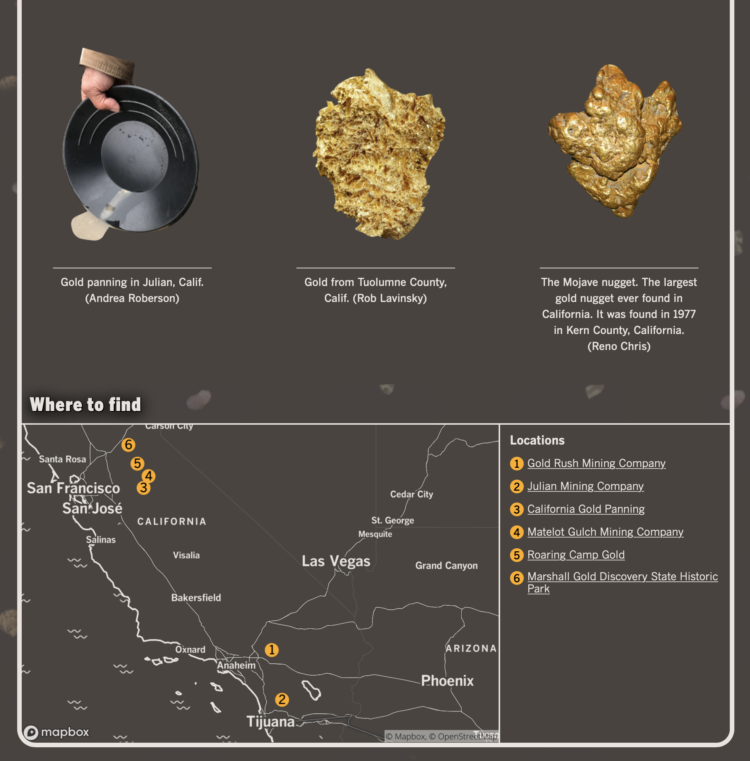
    Any outdoor activity sounds amazing at this point. Andrea Roberson and Casey Miller for Los Angeles Times put together this charming to rockhounding in California. Each rock type has the tools needed, laws, and where to find it. The guide even has some 3-D models in there for good measure.

  • Writing about probability in a way that people will understand

    June 4, 2021

    Topic

    Design  /  uncertainty

    We see probabilities mentioned in the news, in weather forecasts, during sporting events, political arguments, business reports, elections, medical advice, and scientific findings. But probability is a tricky concept that not all (most?) people understand. Grace Huckins for The Open Notebook outlines useful ways to communicate the numbers more clearly — to increase the chances readers do understand.

    On using concrete numbers over percentages:

    Concrete numbers can also make statistics feel more personally relevant. A 0.5 percent risk of developing a particular kind of cancer may seem minuscule. But if a reader went to a high school with 1,000 students, they may find it more impactful to hear that five of their classmates, on average, will develop the disease. In a March 2021 story, American Public Media used concrete numbers rather than percentages to communicate race disparities in COVID deaths. They reported that 1 of every 390 Indigenous Americans had died of COVID.

    Other tips include using visuals, relatable comparisons, and acknowledging uncertainty instead of speaking in absolutes.

  • Page 79 of 391
  • <
  • 1
  • ...
  • 76
  • 77
  • 78
  • 79
  • 80
  • 81
  • ...
  • 391
  • >

Analyze, visualize, and communicate data usefully, beyond the defaults.

Become a member →

Recently for Members

May 8, 2025
When the data is not what it seems

May 1, 2025
Finding the Right Charts

April 24, 2025
Visualization Tools, Datasets, and Resources – April 2025 Roundup

April 17, 2025
Breaking Out of Chart Software Defaults

April 15, 2025
Line Chart with Decorative Neon Accents

Browse by Chart Type See All →

Word Cloud Baseline Chart Packed Bubble Chart Table Area Chart Calendar Cartogram Voronoi Diagram Dot Density Map Organogram

Browse By Topic

  • Visualization

    Seeing data

  • Maps

    Seeing geographic data

  • Infographics

    Explaining data

  • Networks

    Connecting data

  • Statistics

    Analyzing data

  • Software

    Working with data

  • Sources

    Getting data

  • Design

    Making data readable

Get the Book

Visualize This: The FlowingData Guide to Design, Visualization, and Statistics

Available now.

Order: Amazon / Bookshop

Made by FlowingData

  • The Process

  • Data Underload

  • Chart Everything

  • Guides

  • Books

  • Shop

  • About
  • Contact
  • Newsletter
  • LinkedIn
  • Instagram
  • Bluesky
  • RSS
Copyright © 2007-Present FlowingData. All rights reserved.